INVITE-ONLY SCRIPT
更新済 Bullish/Bearish Phases
Hello traders!
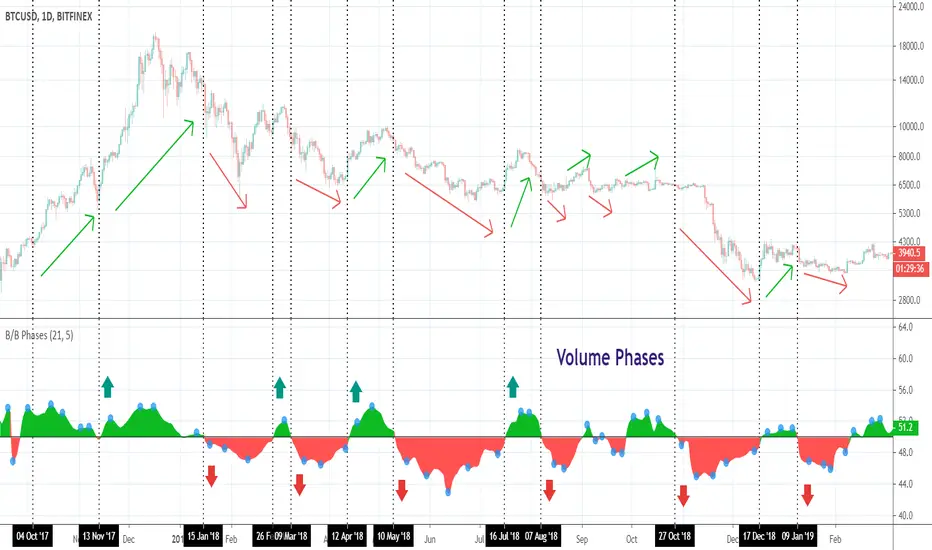
This indicator shows you bullish or bearish dominance during the specified period and is based on the volume calculations. Why? Volume acts as an excellent confirmation tool of the price movements and is used to determine if an instrument is gaining or losing momentum.
Bullish/Bearish Phases can be used to find out divergences with the price. It will work on ANY instrument that has available volume data.
NOTE: The blue circles appear on the local peaks.
I attached some screenshots to show you how it works with other instruments.


Happy Trading!
This indicator shows you bullish or bearish dominance during the specified period and is based on the volume calculations. Why? Volume acts as an excellent confirmation tool of the price movements and is used to determine if an instrument is gaining or losing momentum.
Bullish/Bearish Phases can be used to find out divergences with the price. It will work on ANY instrument that has available volume data.
NOTE: The blue circles appear on the local peaks.
I attached some screenshots to show you how it works with other instruments.
Happy Trading!
リリースノート
- Changed styling
リリースノート
- Added smoothing with Jurik Moving Average
リリースノート
- Update
招待専用スクリプト
このスクリプトは作者が承認したユーザーのみアクセス可能です。使用するにはアクセス申請をして許可を得る必要があります。通常は支払い後に承認されます。詳細は下記の作者の指示に従うか、evergetに直接お問い合わせください。
TradingViewは、作者を完全に信頼し、スクリプトの動作を理解していない限り、有料スクリプトの購入・使用を推奨しません。コミュニティスクリプトには無料のオープンソースの代替が多数あります。
作者の指示
If you have any questions, feel free to ask them and contact me via private messages on TradingView or via Telegram @alex_everget
👨🏻💻 Coding services -> Telegram: @alex_everget
🆓 List of my FREE indicators: bit.ly/2S7EPuN
💰 List of my PREMIUM indicators: bit.ly/33MA81f
Join Bybit and get up to $6,045 in bonuses!
bybit.com/invite?ref=56ZLQ0Z
🆓 List of my FREE indicators: bit.ly/2S7EPuN
💰 List of my PREMIUM indicators: bit.ly/33MA81f
Join Bybit and get up to $6,045 in bonuses!
bybit.com/invite?ref=56ZLQ0Z
免責事項
この情報および投稿は、TradingViewが提供または推奨する金融、投資、トレード、その他のアドバイスや推奨を意図するものではなく、それらを構成するものでもありません。詳細は利用規約をご覧ください。