OPEN-SOURCE SCRIPT
更新済 Squeeze Momentum Signal Overlay [GN]
Companion script for Squeeze Momentum Indicator that plots the signal on chart.
リリースノート
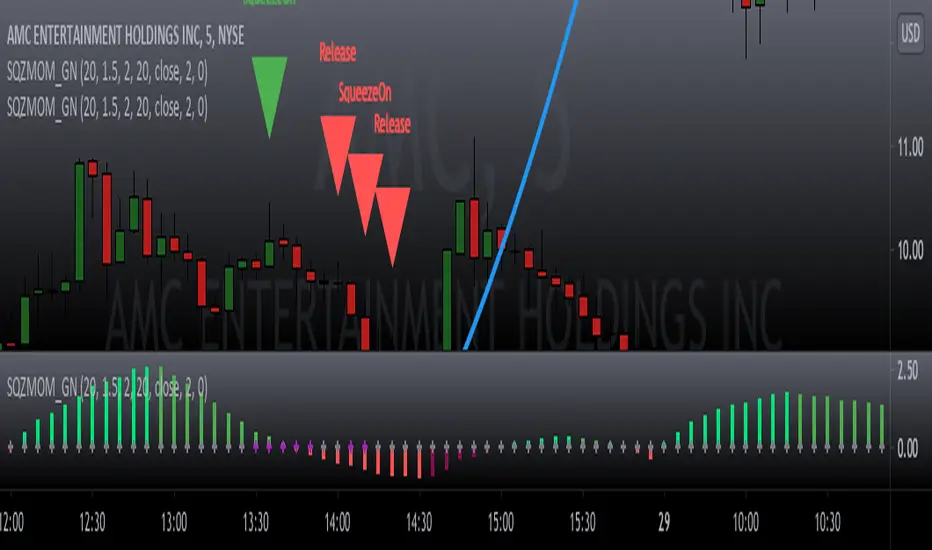
Squeeze Momentum Indicator shows when Bollinger Bands squeeze into the Keltner Channel. When this condition is met, price consolidation is typically followed by a move up or down. The histogram in the indicator helps predict direction of the price action breakout. If the histogram is flipping from red to green, the signal is bullish. If the histogram is flipping from green to red, the signal is bearish.This is a companion script that overlays the squeeze signals onto a chart.
リリースノート
This script includes the direction of momentum using Red-Green triangles. A bullish signal occurs when the SqueezeOn triangle is Red and the Release triangle is Green; a bearish signal occurs when the SqueezOn triangle is Green and the Release triangle is red. オープンソーススクリプト
TradingViewの精神に則り、このスクリプトの作者はコードをオープンソースとして公開してくれました。トレーダーが内容を確認・検証できるようにという配慮です。作者に拍手を送りましょう!無料で利用できますが、コードの再公開はハウスルールに従う必要があります。
免責事項
この情報および投稿は、TradingViewが提供または推奨する金融、投資、トレード、その他のアドバイスや推奨を意図するものではなく、それらを構成するものでもありません。詳細は利用規約をご覧ください。
オープンソーススクリプト
TradingViewの精神に則り、このスクリプトの作者はコードをオープンソースとして公開してくれました。トレーダーが内容を確認・検証できるようにという配慮です。作者に拍手を送りましょう!無料で利用できますが、コードの再公開はハウスルールに従う必要があります。
免責事項
この情報および投稿は、TradingViewが提供または推奨する金融、投資、トレード、その他のアドバイスや推奨を意図するものではなく、それらを構成するものでもありません。詳細は利用規約をご覧ください。