OPEN-SOURCE SCRIPT
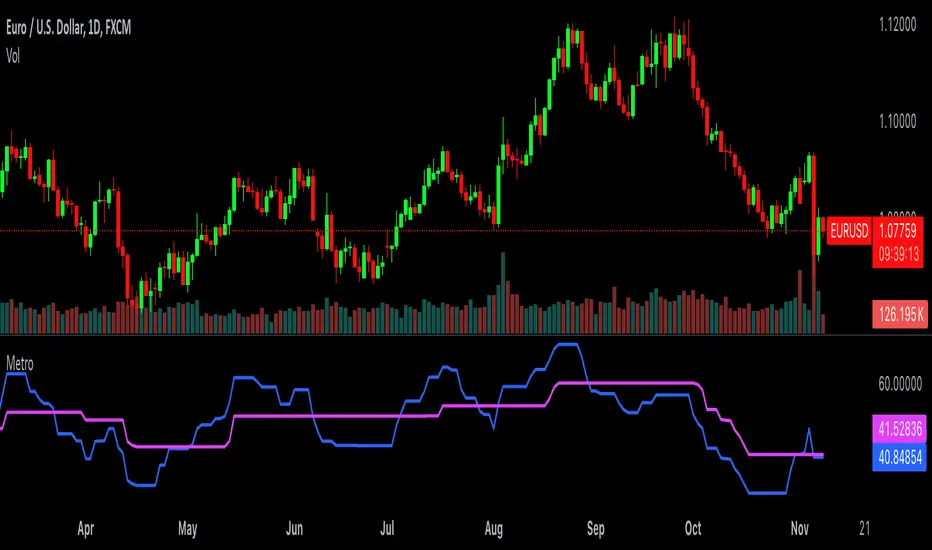
Simplified Metro

This is a derivative of J. Welles Wilder's RSI (Relative Strength Index) from 1978. This version uses a fast and slow offset of the RSI to create signals. The RSI itself has been removed from this version for visual simplicity, but its setting still has an impact on the fast and slow stepped lines.
The "RSI Period" sets the number of bars used to calculate the RSI. A higher value results in a smoother RSI, while a lower value makes it more reactive to price changes.
The "Fast Step Size" defines the step size for the fast trend line. A larger value makes the fast step line less sensitive to RSI changes, creating a smoother line.
The "Slow Step Size" defines the step size for the slow trend line. A larger value makes the slow step line less sensitive to RSI changes, resulting in a smoother line compared to the fast step.
When the faster blue line crosses and closes above the slower fuchsia line we have a signal to go long, and vice versa we take a short position.
This indicator should not be traded on its own, but could be a valuable addition to a system used for identifying trends.
オープンソーススクリプト
TradingViewの精神に則り、このスクリプトの作者はコードをオープンソースとして公開してくれました。トレーダーが内容を確認・検証できるようにという配慮です。作者に拍手を送りましょう!無料で利用できますが、コードの再公開はハウスルールに従う必要があります。
免責事項
この情報および投稿は、TradingViewが提供または推奨する金融、投資、トレード、その他のアドバイスや推奨を意図するものではなく、それらを構成するものでもありません。詳細は利用規約をご覧ください。
オープンソーススクリプト
TradingViewの精神に則り、このスクリプトの作者はコードをオープンソースとして公開してくれました。トレーダーが内容を確認・検証できるようにという配慮です。作者に拍手を送りましょう!無料で利用できますが、コードの再公開はハウスルールに従う必要があります。
免責事項
この情報および投稿は、TradingViewが提供または推奨する金融、投資、トレード、その他のアドバイスや推奨を意図するものではなく、それらを構成するものでもありません。詳細は利用規約をご覧ください。