PROTECTED SOURCE SCRIPT
Buy Sell Indicator by Independent Researcher
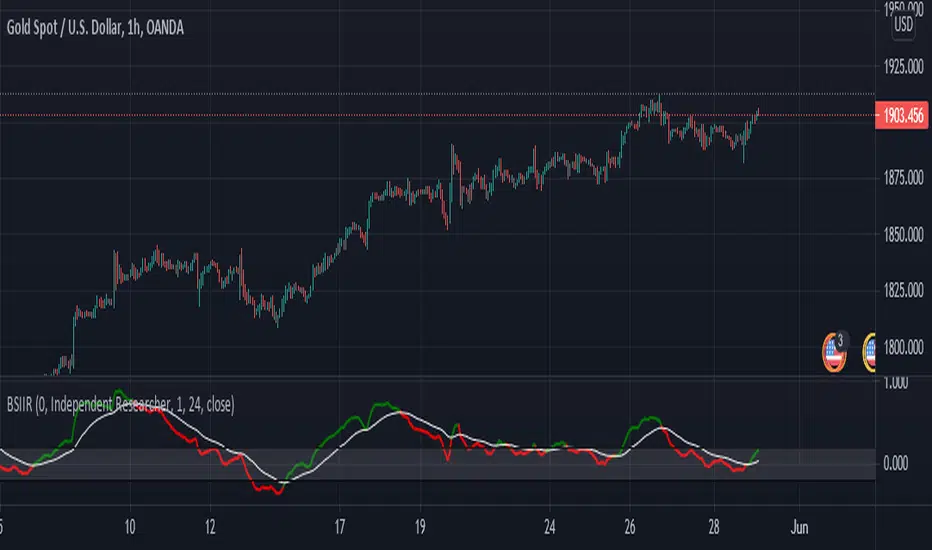
This is an Buy and Sell Oscillator. Its show the trend reversal or change in price action of the market. This indicator is a combination of various moving averages. This is like a MACD but a very powerful version.
How To Use It
Below you will see an example:-
XAUUSD

EURUSD

How To Use It
- If green line gives crossover white line towards down then price is expected to fall.
- If red line gives crossover white line towards up then price is expected to rise.
- For better results of indicator trade after closing of crossover candle.
- There is a band +.20 to -.20 for better results trade on crossover happens between that band.
Below you will see an example:-
XAUUSD
EURUSD
保護スクリプト
このスクリプトのソースコードは非公開で投稿されています。 ただし、制限なく自由に使用できます – 詳細はこちらでご確認ください。
免責事項
この情報および投稿は、TradingViewが提供または推奨する金融、投資、トレード、その他のアドバイスや推奨を意図するものではなく、それらを構成するものでもありません。詳細は利用規約をご覧ください。
保護スクリプト
このスクリプトのソースコードは非公開で投稿されています。 ただし、制限なく自由に使用できます – 詳細はこちらでご確認ください。
免責事項
この情報および投稿は、TradingViewが提供または推奨する金融、投資、トレード、その他のアドバイスや推奨を意図するものではなく、それらを構成するものでもありません。詳細は利用規約をご覧ください。