OPEN-SOURCE SCRIPT
更新済 Relative Performance
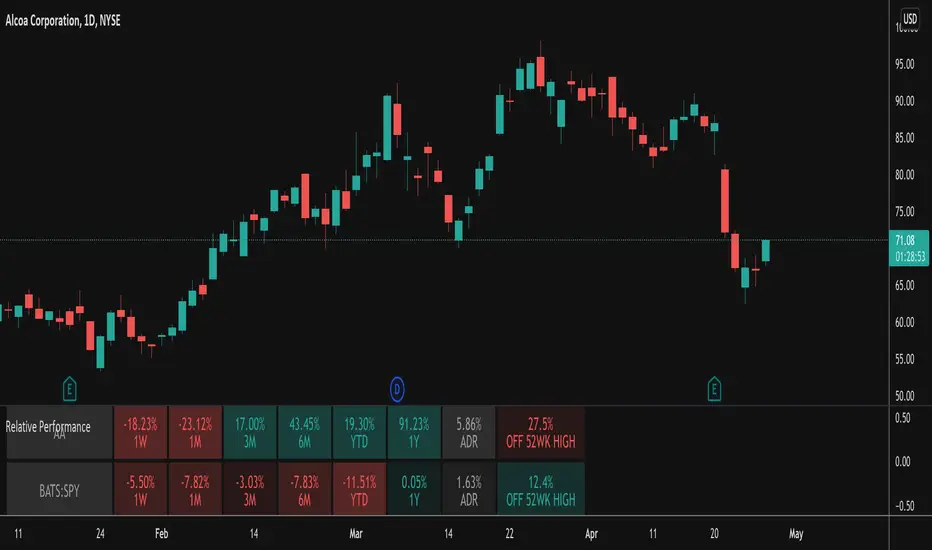
This indicator takes the Performance Table from BeeHolder and converts it to a Relative Performance table so you can compare the current chart vs. an Index (or whatever other ticker you want) to see the relative performance of one vs. the other. I also added a cell for ADR, which is also the same value as "Monthly Volatility" in the stock screener. This can be useful when screening stocks based on performance and volatility.
リリースノート
Conversion to Pine v5Added a box to the table that looks at the distance from the 52 week high. The idea behind this is that the strongest stocks will be close to their highs and that's what you should focus on. I've coded it so that if a stock is within 25% of its 52 week high the color will be green indicating a good candidate.
リリースノート
Changed the calculation for distance from the 52 week high to be the drawdown off the high instead of the percentage required to get back to the high as I think this is what people usually refer to when talking about this metric.オープンソーススクリプト
TradingViewの精神に則り、このスクリプトの作者はコードをオープンソースとして公開してくれました。トレーダーが内容を確認・検証できるようにという配慮です。作者に拍手を送りましょう!無料で利用できますが、コードの再公開はハウスルールに従う必要があります。
免責事項
この情報および投稿は、TradingViewが提供または推奨する金融、投資、トレード、その他のアドバイスや推奨を意図するものではなく、それらを構成するものでもありません。詳細は利用規約をご覧ください。
オープンソーススクリプト
TradingViewの精神に則り、このスクリプトの作者はコードをオープンソースとして公開してくれました。トレーダーが内容を確認・検証できるようにという配慮です。作者に拍手を送りましょう!無料で利用できますが、コードの再公開はハウスルールに従う必要があります。
免責事項
この情報および投稿は、TradingViewが提供または推奨する金融、投資、トレード、その他のアドバイスや推奨を意図するものではなく、それらを構成するものでもありません。詳細は利用規約をご覧ください。