OPEN-SOURCE SCRIPT
Multi-Timeframe EMAs
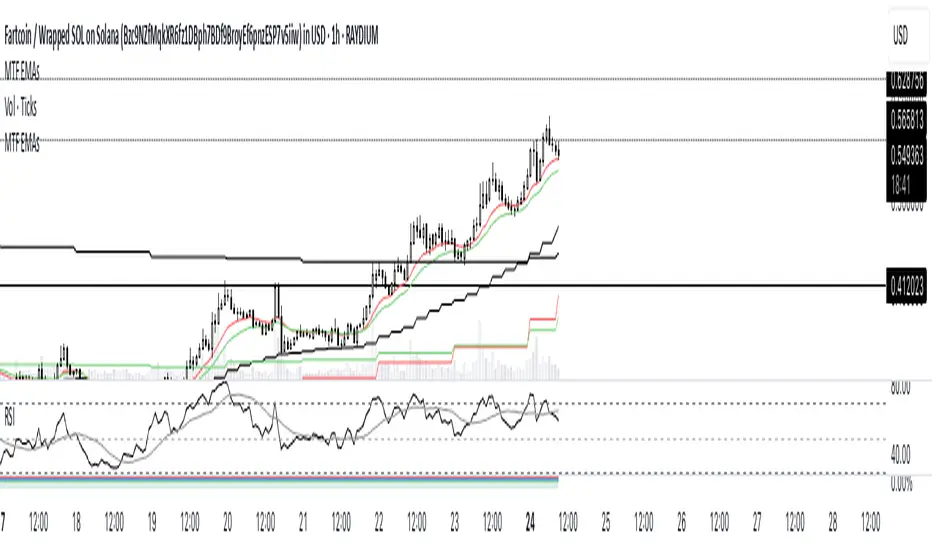
This TradingView indicator provides a comprehensive overview of price momentum by overlaying multiple Exponential Moving Averages (EMAs) from different timeframes onto a single chart. By combining 1-hour, 4-hour, and daily EMAs, you can observe short-term trends while simultaneously monitoring medium-term and long-term market dynamics. The 1-hour EMA 13 and EMA 21 help capture rapid price changes, which is useful for scalpers or intraday traders looking to identify sudden momentum shifts. Meanwhile, the 4-hour EMA 21 offers a more stable, intermediate perspective, filtering out some of the noise found in shorter intervals. Finally, the daily EMAs (13, 25, and 50) highlight prevailing market sentiment over a longer period, enabling traders to assess higher-level trends and gauge whether short-term signals align with overarching tendencies. By plotting all these EMAs together, it becomes easier to detect confluences or divergences across different time horizons, making it simpler to refine entries and exits based on multi-timeframe confirmation. This script is especially helpful for swing traders and position traders who wish to ensure that smaller timeframe strategies do not conflict with long-term market direction.
オープンソーススクリプト
TradingViewの精神に則り、このスクリプトの作者はコードをオープンソースとして公開してくれました。トレーダーが内容を確認・検証できるようにという配慮です。作者に拍手を送りましょう!無料で利用できますが、コードの再公開はハウスルールに従う必要があります。
免責事項
この情報および投稿は、TradingViewが提供または推奨する金融、投資、トレード、その他のアドバイスや推奨を意図するものではなく、それらを構成するものでもありません。詳細は利用規約をご覧ください。
オープンソーススクリプト
TradingViewの精神に則り、このスクリプトの作者はコードをオープンソースとして公開してくれました。トレーダーが内容を確認・検証できるようにという配慮です。作者に拍手を送りましょう!無料で利用できますが、コードの再公開はハウスルールに従う必要があります。
免責事項
この情報および投稿は、TradingViewが提供または推奨する金融、投資、トレード、その他のアドバイスや推奨を意図するものではなく、それらを構成するものでもありません。詳細は利用規約をご覧ください。