OPEN-SOURCE SCRIPT
更新済 FIBI
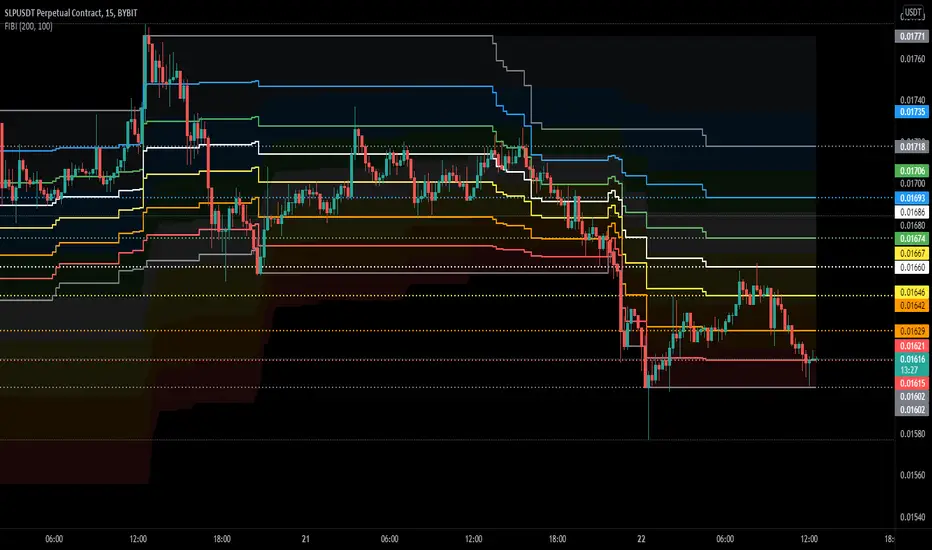
Shows Fibonacci waves for a long range and Fibonacci lines for a short range.
For me it helps to identify key levels or confluence on the macro and micro range.
In the example above you can clearly see that the macro waves are in a down-trend while the micro lines are in a up-trend..
Also the price has been rejected at the 78.6 fib mirco line but found support on the 78.6 macro wave.
these situations are hard to find with the default retracement tools
リリースノート
Code clean upリリースノート
Using bands instead of areaリリースノート
Chart updatedリリースノート
Added 23.6 FIBオープンソーススクリプト
TradingViewの精神に則り、このスクリプトの作者はコードをオープンソースとして公開してくれました。トレーダーが内容を確認・検証できるようにという配慮です。作者に拍手を送りましょう!無料で利用できますが、コードの再公開はハウスルールに従う必要があります。
免責事項
この情報および投稿は、TradingViewが提供または推奨する金融、投資、トレード、その他のアドバイスや推奨を意図するものではなく、それらを構成するものでもありません。詳細は利用規約をご覧ください。
オープンソーススクリプト
TradingViewの精神に則り、このスクリプトの作者はコードをオープンソースとして公開してくれました。トレーダーが内容を確認・検証できるようにという配慮です。作者に拍手を送りましょう!無料で利用できますが、コードの再公開はハウスルールに従う必要があります。
免責事項
この情報および投稿は、TradingViewが提供または推奨する金融、投資、トレード、その他のアドバイスや推奨を意図するものではなく、それらを構成するものでもありません。詳細は利用規約をご覧ください。