OPEN-SOURCE SCRIPT
Tick Time/Speed
The Tick Time/Speed indicator highlights the latest TradingView feature, Tick Charts (beta), and aims to provide a visual representation of the speed.
🔶 USAGE

1-minute chart
Unlike regular charts, where the time difference between two bars is relatively equal, the time difference between two tick bars can vary.

1T chart


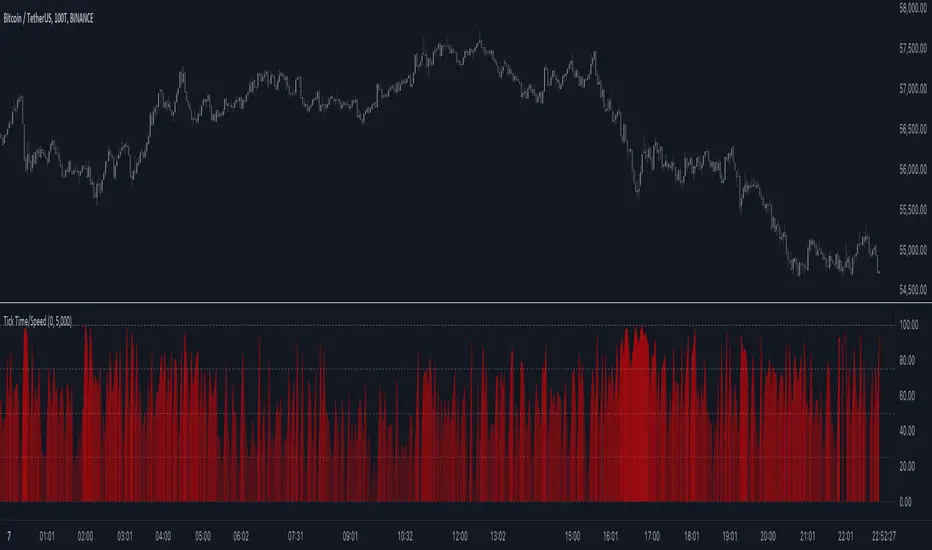
10T chart (ticks groups per 10)

100T chart (ticks groups per 100)
(zoom in to see the time scale, as can be seen in the above two examples, higher values represent more ticks in a shorter period of time)
The difference in time (speed) against previous tick(s) is added to an array and sorted. The measured speed is compared against every value in the array and then plotted.
A smaller difference in time against other ticks (more ticks in less time) is plotted higher, while a more prominent time difference is plotted at a lower level.
The amount of data (to compare with) can be set by "Calculated Bars".

The above example uses data from the last 5000, 100, and 77 bars.
🔶 SETTINGS
• Color & transparency setting
• Calculated Bars: sets the size of the array; in other words, sets the amount of available data for 'speed' comparison
🔶 NOTES
🔶 USAGE
1-minute chart
Unlike regular charts, where the time difference between two bars is relatively equal, the time difference between two tick bars can vary.
1T chart
10T chart (ticks groups per 10)
100T chart (ticks groups per 100)
(zoom in to see the time scale, as can be seen in the above two examples, higher values represent more ticks in a shorter period of time)
The difference in time (speed) against previous tick(s) is added to an array and sorted. The measured speed is compared against every value in the array and then plotted.
A smaller difference in time against other ticks (more ticks in less time) is plotted higher, while a more prominent time difference is plotted at a lower level.
The amount of data (to compare with) can be set by "Calculated Bars".
The above example uses data from the last 5000, 100, and 77 bars.
🔶 SETTINGS
• Color & transparency setting
• Calculated Bars: sets the size of the array; in other words, sets the amount of available data for 'speed' comparison
🔶 NOTES
- At this point of time, Tick Charts are only reserved for Professional-tier plans – Expert, Elite, or Ultimate plan.
- The indicator can only be used with Tick Data.
- Not all exchanges have tick data at the moment, this means not every ticker will have Tick Data.
オープンソーススクリプト
TradingViewの精神に則り、このスクリプトの作者はコードをオープンソースとして公開してくれました。トレーダーが内容を確認・検証できるようにという配慮です。作者に拍手を送りましょう!無料で利用できますが、コードの再公開はハウスルールに従う必要があります。
Who are PineCoders?
tradingview.com/chart/SSP/yW5eOqtm-Who-are-PineCoders/
TG Pine Script® Q&A: t.me/PineCodersQA
- We cannot control our emotions,
but we can control our keyboard -
tradingview.com/chart/SSP/yW5eOqtm-Who-are-PineCoders/
TG Pine Script® Q&A: t.me/PineCodersQA
- We cannot control our emotions,
but we can control our keyboard -
免責事項
この情報および投稿は、TradingViewが提供または推奨する金融、投資、トレード、その他のアドバイスや推奨を意図するものではなく、それらを構成するものでもありません。詳細は利用規約をご覧ください。