PROTECTED SOURCE SCRIPT
更新済 Wolf Alerts Signals

Wolf Alerts Signals
This is an indicator of possible market entry.
Indicates with an arrow the direction and with a letter the intensity ("H" High or "L" Low).
Everything is calculated by comparing RSI and Volumes.
produced by zstiziano
This is an indicator of possible market entry.
Indicates with an arrow the direction and with a letter the intensity ("H" High or "L" Low).
Everything is calculated by comparing RSI and Volumes.
produced by zstiziano
リリースノート
Adjustment of short values.リリースノート
Update リリースノート
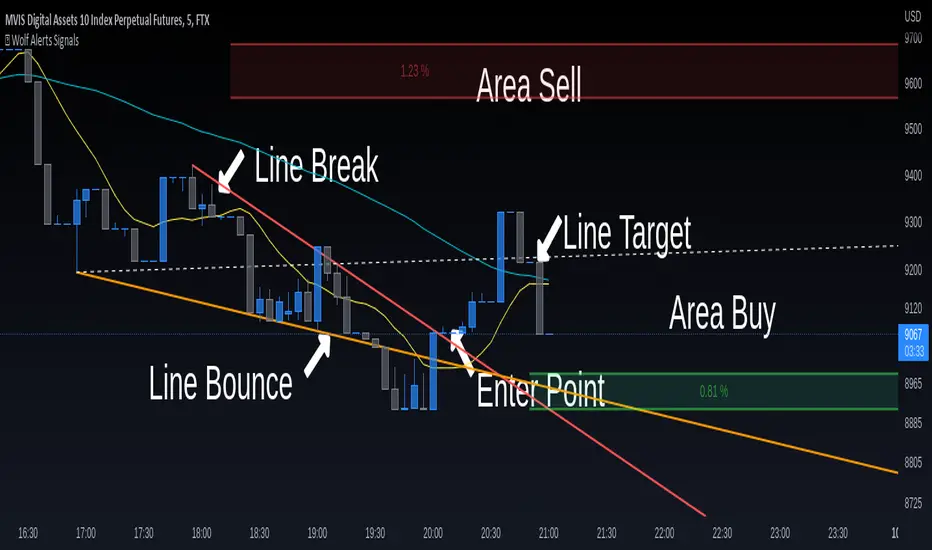
This indicator helps you find:- trend direction thanks to 3 moving averages
- breaking points of the trend lines
- buying and selling areas with the highest trade
- signals of too much sold or too much bought
Help this project with a small donation:
https://www.paypal.com/donate/?hosted_button_id=XFWT7XME5DRFE
リリースノート
EXAMPLE LONG
EXAMPLE SHORT
▬▬▬▬▬▬▬▬▬▬▬▬▬▬▬▬▬▬▬▬▬▬▬▬▬▬▬▬▬▬▬▬▬▬▬
SUPPORT THIS PROJECT
▬▬▬▬▬▬▬▬▬▬▬▬▬▬▬▬▬▬▬▬▬▬▬▬▬▬▬▬▬▬▬▬▬▬▬
💰 [url= paypal.com/donate/?hosted_button_id=XFWT7XME5DRFE ] paypal.com/donate/?hosted_button_id=XFWT7XME5DRFE 💰
リリースノート
fix bugリリースノート
- fix trend line- add line target
▬▬▬▬▬▬▬▬▬▬▬▬▬▬▬▬▬▬▬▬▬▬▬▬▬▬▬▬▬▬▬▬▬▬▬
SUPPORT THIS PROJECT
💰 DONATE WITH PAYPAL 💰
[url= paypal.com/donate/?hosted_button_id=XFWT7XME5DRFE ] paypal.com/donate/?hosted_button_id=XFWT7XME5DRFE ▬▬▬▬▬▬▬▬▬▬▬▬▬▬▬▬▬▬▬▬▬▬▬▬▬▬▬▬▬▬▬▬▬▬▬
リリースノート
- added the possibility to choose whether to consider the shadow or not
保護スクリプト
このスクリプトのソースコードは非公開で投稿されています。 ただし、制限なく自由に使用できます – 詳細はこちらでご確認ください。
免責事項
この情報および投稿は、TradingViewが提供または推奨する金融、投資、トレード、その他のアドバイスや推奨を意図するものではなく、それらを構成するものでもありません。詳細は利用規約をご覧ください。
保護スクリプト
このスクリプトのソースコードは非公開で投稿されています。 ただし、制限なく自由に使用できます – 詳細はこちらでご確認ください。
免責事項
この情報および投稿は、TradingViewが提供または推奨する金融、投資、トレード、その他のアドバイスや推奨を意図するものではなく、それらを構成するものでもありません。詳細は利用規約をご覧ください。