OPEN-SOURCE SCRIPT
Daily Performance Heatmap

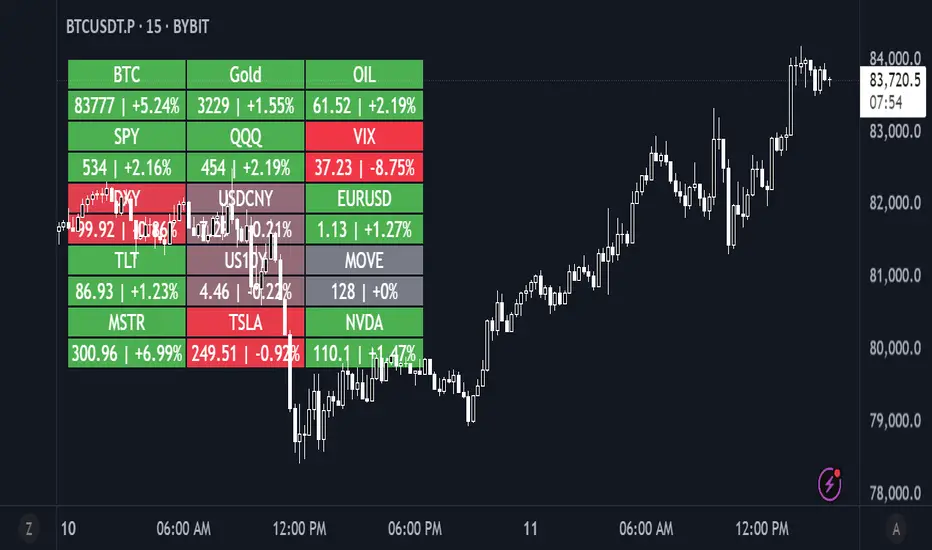
This script displays a customizable daily performance heatmap for key assets across crypto, equities, bonds, commodities, currencies, and volatility indices.
Each cell shows the current price and the percent change since the daily open, color-coded using a gradient from negative to positive. Assets are arranged in a left-to-right, top-down grid, with adjustable layout and styling.
⚙️ Features:
🔢 Displays current price and daily % change
🎨 Color-coded heatmap using customizable gradients
🧱 Adjustable layout: number of columns, cell size, and text size
🧠 Smart price formatting (no decimals for BTC, Gold, etc.)
🪟 Clean alignment with padded spacing for UI clarity
🛠️ Future plans:
User-input asset lists and labels
Category grouping and dynamic sorting
Optional icons, tooltips, or alerts
オープンソーススクリプト
TradingViewの精神に則り、このスクリプトの作者はコードをオープンソースとして公開してくれました。トレーダーが内容を確認・検証できるようにという配慮です。作者に拍手を送りましょう!無料で利用できますが、コードの再公開はハウスルールに従う必要があります。
免責事項
この情報および投稿は、TradingViewが提供または推奨する金融、投資、トレード、その他のアドバイスや推奨を意図するものではなく、それらを構成するものでもありません。詳細は利用規約をご覧ください。
オープンソーススクリプト
TradingViewの精神に則り、このスクリプトの作者はコードをオープンソースとして公開してくれました。トレーダーが内容を確認・検証できるようにという配慮です。作者に拍手を送りましょう!無料で利用できますが、コードの再公開はハウスルールに従う必要があります。
免責事項
この情報および投稿は、TradingViewが提供または推奨する金融、投資、トレード、その他のアドバイスや推奨を意図するものではなく、それらを構成するものでもありません。詳細は利用規約をご覧ください。