OPEN-SOURCE SCRIPT
RSI Instant Divergence
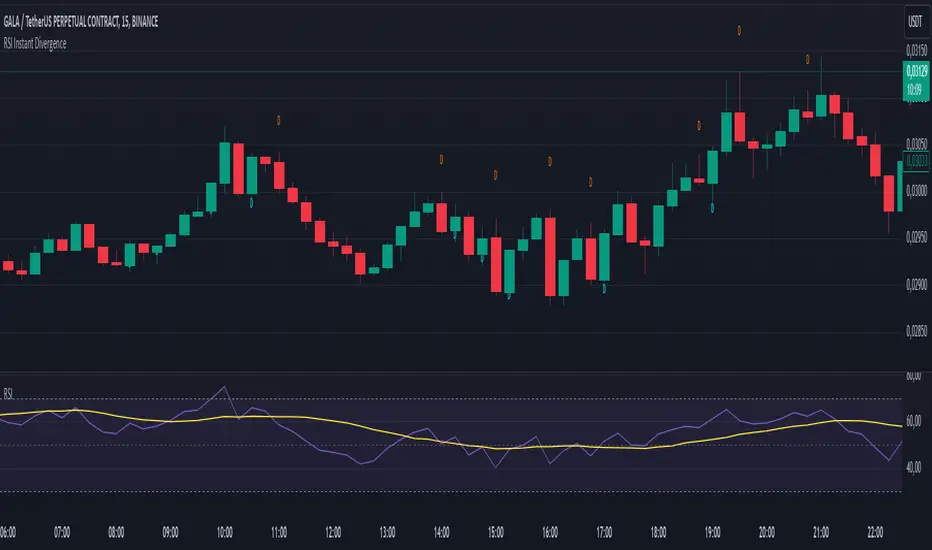
This script detects RSI divergence—a common signal indicating potential trend reversals. It compares price action and RSI behavior to identify two types of divergences:
1- Bearish Divergence (Sell Signal):
Occurs when the price forms a higher high while RSI drops (weaker momentum).
A label appears above the candle, and an alert is triggered: "Divergence: Sell Signal."
2 -Bullish Divergence (Buy Signal):
Occurs when the price makes a lower low while RSI rises (stronger momentum).
A label appears below the candle, and an alert is triggered: "Divergence: Buy Signal."
The labels are color-coded (orange for sell, blue for buy) and include detailed RSI and price info in a tooltip. Alerts help you act immediately when divergence is detected.
This tool is perfect for spotting potential trend reversals and refining your entry/exit strategy. Let me know if you'd like to customize it further! 😊
Tooltip Feature: Each label includes a tooltip with precise RSI and price details (current and previous values) as well as the percentage change in RSI, giving you deeper insight into the divergence. This tool is great for identifying trend reversal points and includes visual labels, tooltips, and alerts to make real-time trading decisions easier. Let me know if you’d like adjustments!
オープンソーススクリプト
TradingViewの精神に則り、このスクリプトの作者はコードをオープンソースとして公開してくれました。トレーダーが内容を確認・検証できるようにという配慮です。作者に拍手を送りましょう!無料で利用できますが、コードの再公開はハウスルールに従う必要があります。
免責事項
この情報および投稿は、TradingViewが提供または推奨する金融、投資、トレード、その他のアドバイスや推奨を意図するものではなく、それらを構成するものでもありません。詳細は利用規約をご覧ください。
オープンソーススクリプト
TradingViewの精神に則り、このスクリプトの作者はコードをオープンソースとして公開してくれました。トレーダーが内容を確認・検証できるようにという配慮です。作者に拍手を送りましょう!無料で利用できますが、コードの再公開はハウスルールに従う必要があります。
免責事項
この情報および投稿は、TradingViewが提供または推奨する金融、投資、トレード、その他のアドバイスや推奨を意図するものではなく、それらを構成するものでもありません。詳細は利用規約をご覧ください。