OPEN-SOURCE SCRIPT
更新済 9-20 sma multi timeframe indicator
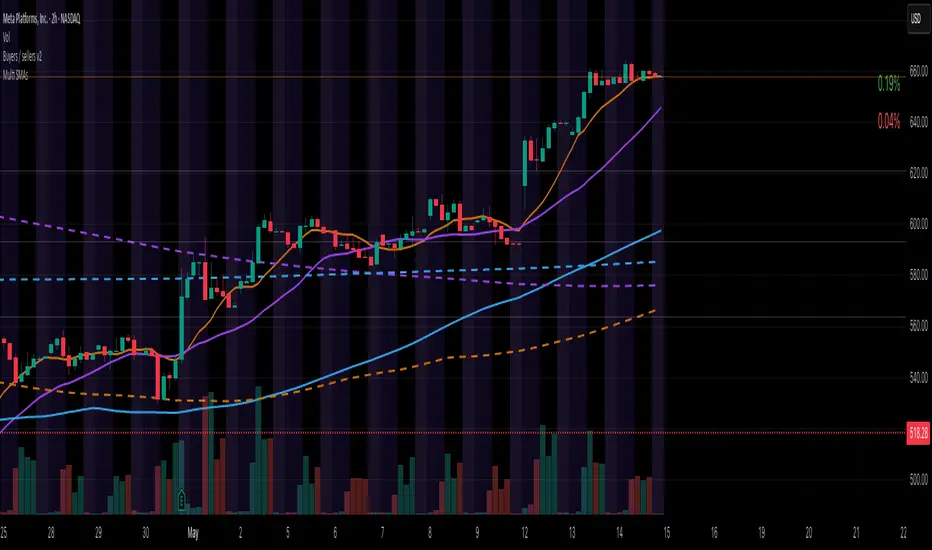
This is an indicator to help visualizing the 9 and the 20 sma on 3 different timeframes.
When they cross, you will see a cross on the band representing the timeframe.
When a trade is favorable the band will color in green for up trend and in red for downtrend:
- Conditions in uptrend: Start after the first green candle closed above the 9 sma, Stop after the first red candle closed under the 9 sma
- Conditions in downtrend: Start after the first red candle closed below the 9 sma, Stop after the first green candle closed above the 9 sma
リリースノート
updated titleリリースノート
Fixed timeframe calculation for the "D" taking into account extended market / futures / cryptoオープンソーススクリプト
TradingViewの精神に則り、このスクリプトの作者はコードをオープンソースとして公開してくれました。トレーダーが内容を確認・検証できるようにという配慮です。作者に拍手を送りましょう!無料で利用できますが、コードの再公開はハウスルールに従う必要があります。
免責事項
この情報および投稿は、TradingViewが提供または推奨する金融、投資、トレード、その他のアドバイスや推奨を意図するものではなく、それらを構成するものでもありません。詳細は利用規約をご覧ください。
オープンソーススクリプト
TradingViewの精神に則り、このスクリプトの作者はコードをオープンソースとして公開してくれました。トレーダーが内容を確認・検証できるようにという配慮です。作者に拍手を送りましょう!無料で利用できますが、コードの再公開はハウスルールに従う必要があります。
免責事項
この情報および投稿は、TradingViewが提供または推奨する金融、投資、トレード、その他のアドバイスや推奨を意図するものではなく、それらを構成するものでもありません。詳細は利用規約をご覧ください。