OPEN-SOURCE SCRIPT
更新済 level_stats
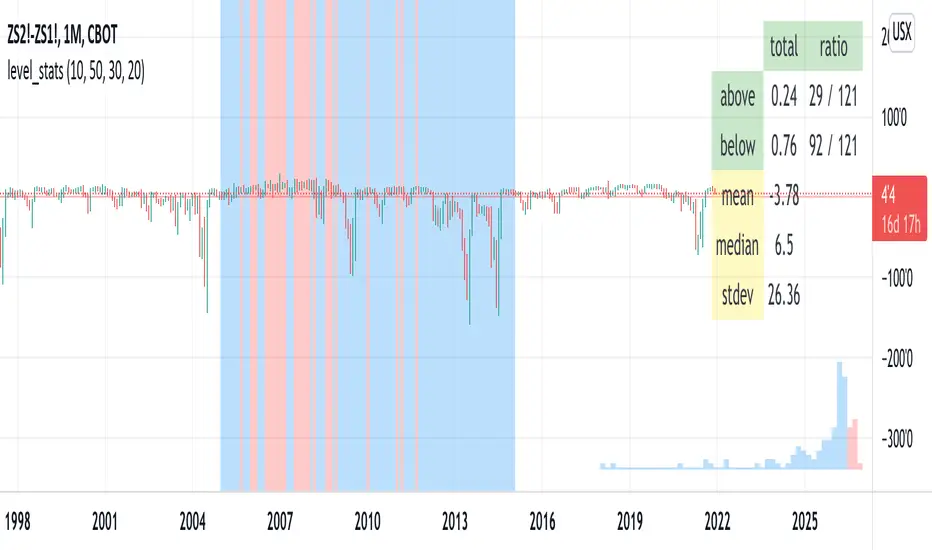
This script tells you the percentage of time an instrument's closing value is above and below a level of your choosing. The background color visually indicates periods where the instrument closed at or above the level (red) and below it (blue). For "stationary-ish" processes, you can get a loose feel for the mean, high, and low values. The historical information conveyed through the background coloring can help you plan derivatives trades. Try with your favorite pairs, commodities, or volatility indices.
Usage: pick a level of interest using the input.
Usage: pick a level of interest using the input.
リリースノート
Added a histogram to depict the distribution of closing prices. Prices less than the "level" input are blue, while those above the level are red. This color scheme is also used to color the chart background.リリースノート
removed some debug codeリリースノート
added mean, median, and stdevリリースノート
Added a date selection. The statistics and histogram will reflect only the period [ start, end ).リリースノート
added a horizontal line (light red) to indicate the levelリリースノート
The histogram's width, height, and number of buckets are now adjustable inputs. More buckets will make the histogram somewhat smoother and more detailed, but at the cost of performance. The maximum number of buckets is probably around 80. The width and height units are "percentage of the screen".I have set the defaults at levels that perform reasonably well.
オープンソーススクリプト
TradingViewの精神に則り、このスクリプトの作者はコードをオープンソースとして公開してくれました。トレーダーが内容を確認・検証できるようにという配慮です。作者に拍手を送りましょう!無料で利用できますが、コードの再公開はハウスルールに従う必要があります。
免責事項
この情報および投稿は、TradingViewが提供または推奨する金融、投資、トレード、その他のアドバイスや推奨を意図するものではなく、それらを構成するものでもありません。詳細は利用規約をご覧ください。
オープンソーススクリプト
TradingViewの精神に則り、このスクリプトの作者はコードをオープンソースとして公開してくれました。トレーダーが内容を確認・検証できるようにという配慮です。作者に拍手を送りましょう!無料で利用できますが、コードの再公開はハウスルールに従う必要があります。
免責事項
この情報および投稿は、TradingViewが提供または推奨する金融、投資、トレード、その他のアドバイスや推奨を意図するものではなく、それらを構成するものでもありません。詳細は利用規約をご覧ください。