OPEN-SOURCE SCRIPT
Double EMA & SMA
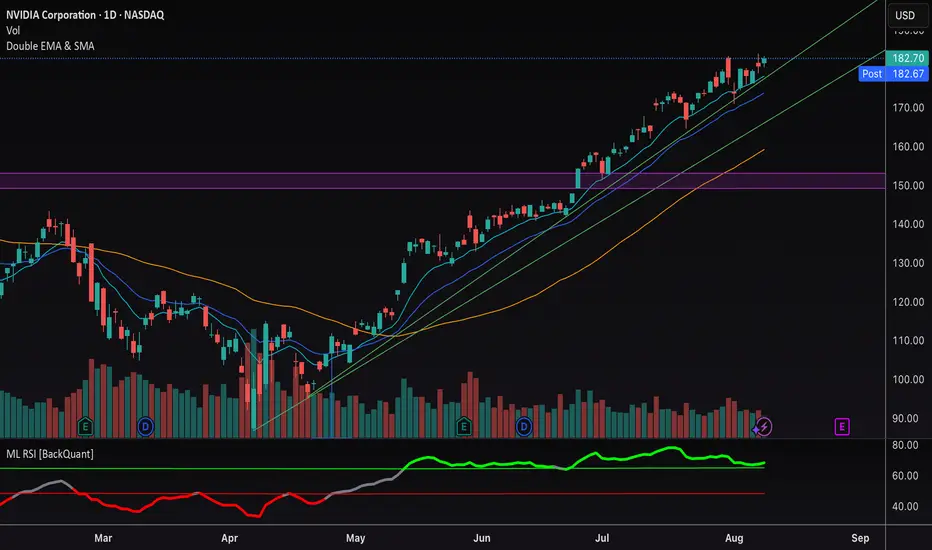
This indicator plots two Exponential Moving Averages (EMAs) and one Simple Moving Average (SMA) directly on the price chart to help identify market trends and momentum shifts.
By default, it displays:
• EMA 1 (10-period) – short-term trend
• EMA 2 (20-period) – medium-term trend
• SMA (50-period) – broader trend baseline
The combination allows traders to quickly spot trend direction, potential reversal points, and areas of dynamic support or resistance. Suitable for scalping, swing trading, and longer-term analysis across any market.
オープンソーススクリプト
TradingViewの精神に則り、このスクリプトの作者はコードをオープンソースとして公開してくれました。トレーダーが内容を確認・検証できるようにという配慮です。作者に拍手を送りましょう!無料で利用できますが、コードの再公開はハウスルールに従う必要があります。
免責事項
この情報および投稿は、TradingViewが提供または推奨する金融、投資、トレード、その他のアドバイスや推奨を意図するものではなく、それらを構成するものでもありません。詳細は利用規約をご覧ください。
オープンソーススクリプト
TradingViewの精神に則り、このスクリプトの作者はコードをオープンソースとして公開してくれました。トレーダーが内容を確認・検証できるようにという配慮です。作者に拍手を送りましょう!無料で利用できますが、コードの再公開はハウスルールに従う必要があります。
免責事項
この情報および投稿は、TradingViewが提供または推奨する金融、投資、トレード、その他のアドバイスや推奨を意図するものではなく、それらを構成するものでもありません。詳細は利用規約をご覧ください。