OPEN-SOURCE SCRIPT
True Relative Strength Index (True RSI / TRSI) [cI8DH]
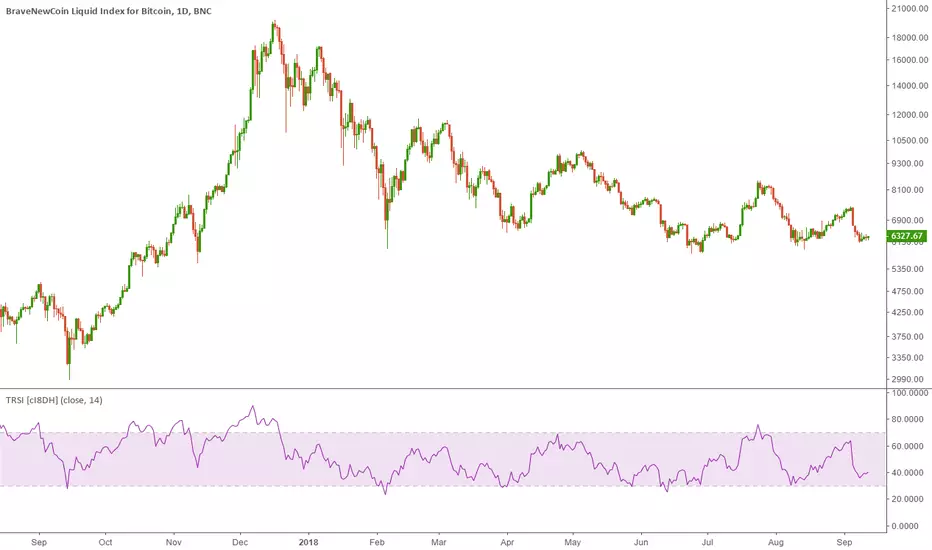
This indicator fixes RSI's bullish bias. This asymmetrical bias is illustrated in the chart below (the lower indicator pair).

This chart also shows that TRSI solves this issues (upper indicator pair). So, time to throw away your RSI. It has been fooling you all along.
FYI, this asymmetry is obvious in longer term charts (wide price ranges).
I kept this script simple for use as a reference. I will update my candle RSI indicator to implement this fix in addition to some other advanced features. So stay tuned :)
![RSI Candles [cI8DH]](https://s3.tradingview.com/d/DWKN9FKg_mid.png)
PS:
I included an option to display standard RSI as well for verifying the RSI equation I used. What you see in textbooks is a twisted version of the same equation.
Thanks DennisLeeBTC for the name suggestion.
This chart also shows that TRSI solves this issues (upper indicator pair). So, time to throw away your RSI. It has been fooling you all along.
FYI, this asymmetry is obvious in longer term charts (wide price ranges).
I kept this script simple for use as a reference. I will update my candle RSI indicator to implement this fix in addition to some other advanced features. So stay tuned :)
PS:
I included an option to display standard RSI as well for verifying the RSI equation I used. What you see in textbooks is a twisted version of the same equation.
Thanks DennisLeeBTC for the name suggestion.
オープンソーススクリプト
TradingViewの精神に則り、このスクリプトの作者はコードをオープンソースとして公開してくれました。トレーダーが内容を確認・検証できるようにという配慮です。作者に拍手を送りましょう!無料で利用できますが、コードの再公開はハウスルールに従う必要があります。
免責事項
この情報および投稿は、TradingViewが提供または推奨する金融、投資、トレード、その他のアドバイスや推奨を意図するものではなく、それらを構成するものでもありません。詳細は利用規約をご覧ください。
オープンソーススクリプト
TradingViewの精神に則り、このスクリプトの作者はコードをオープンソースとして公開してくれました。トレーダーが内容を確認・検証できるようにという配慮です。作者に拍手を送りましょう!無料で利用できますが、コードの再公開はハウスルールに従う必要があります。
免責事項
この情報および投稿は、TradingViewが提供または推奨する金融、投資、トレード、その他のアドバイスや推奨を意図するものではなく、それらを構成するものでもありません。詳細は利用規約をご覧ください。