OPEN-SOURCE SCRIPT
更新済 D-VaR position sizing
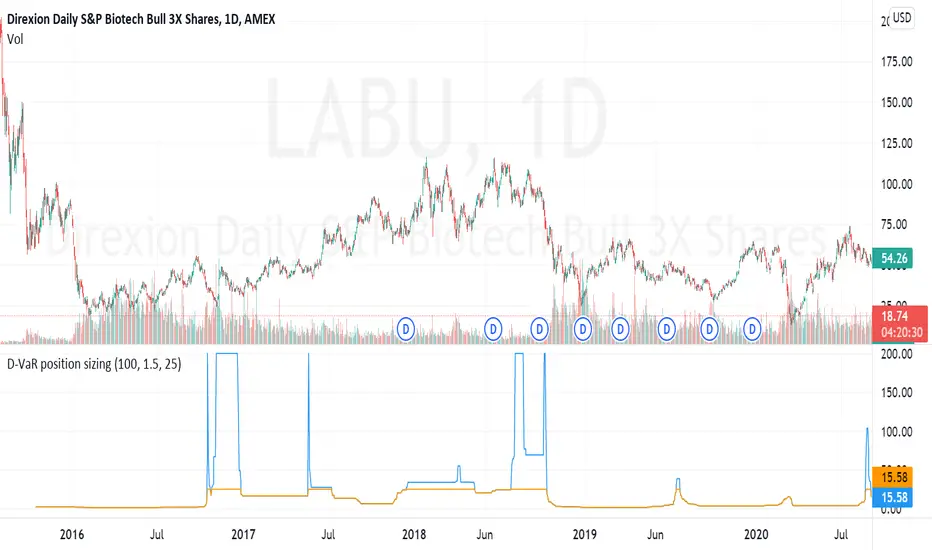
The D-VaR position sizing method was created by David Varadi. It's based on the concept of Value at Risk (VaR) - a widely used measure of the risk of loss in a portfolio based on the statistical analysis of historical price trends and volatilities. You can set the Percent Risk between 1 (lower) and 1.5 (higher); as well as, cap the % of Equity used in the position. The indicator plots the % of equity recommended based on the parameters you set.
リリースノート
Fixed error in percentile_rank formula where it was not accounting for rolling returns. Added a cap of 200% of max equity to position size to limit plot size run-up and reduce exposure to large DVAR calculation when tail-size is extremely small number (i.e. 0.0001, etc.).オープンソーススクリプト
TradingViewの精神に則り、このスクリプトの作者はコードをオープンソースとして公開してくれました。トレーダーが内容を確認・検証できるようにという配慮です。作者に拍手を送りましょう!無料で利用できますが、コードの再公開はハウスルールに従う必要があります。
Need seasonals for futures data on NQ, ES, YM, or other commodities. Check out agresticresearch.com.
免責事項
この情報および投稿は、TradingViewが提供または推奨する金融、投資、トレード、その他のアドバイスや推奨を意図するものではなく、それらを構成するものでもありません。詳細は利用規約をご覧ください。
オープンソーススクリプト
TradingViewの精神に則り、このスクリプトの作者はコードをオープンソースとして公開してくれました。トレーダーが内容を確認・検証できるようにという配慮です。作者に拍手を送りましょう!無料で利用できますが、コードの再公開はハウスルールに従う必要があります。
Need seasonals for futures data on NQ, ES, YM, or other commodities. Check out agresticresearch.com.
免責事項
この情報および投稿は、TradingViewが提供または推奨する金融、投資、トレード、その他のアドバイスや推奨を意図するものではなく、それらを構成するものでもありません。詳細は利用規約をご覧ください。