OPEN-SOURCE SCRIPT
更新済 Spectral Gating (SG)
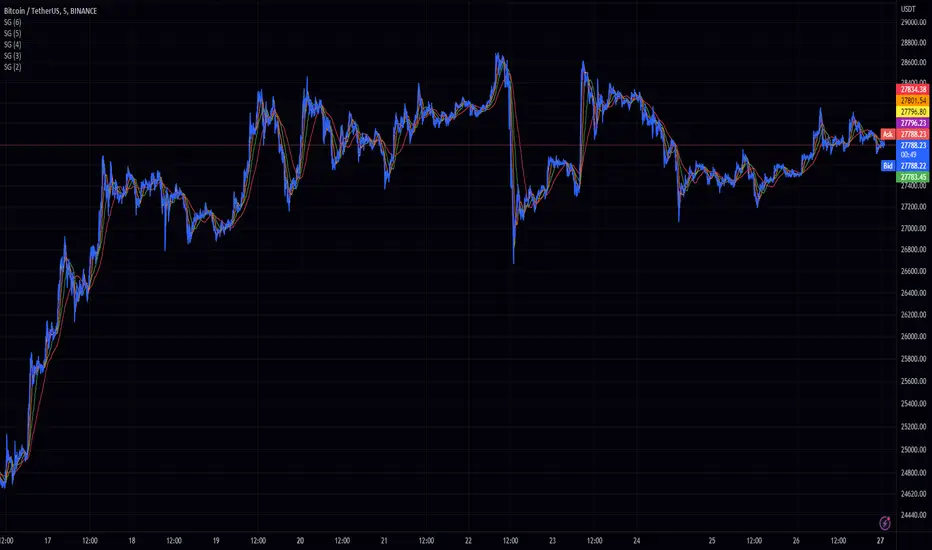
The Spectral Gating (SG) Indicator is a technical analysis tool inspired by music production techniques. It aims to help traders reduce noise in their charts by focusing on the significant frequency components of the data, providing a clearer view of market trends.
By incorporating complex number operations and Fast Fourier Transform (FFT) algorithms, the SG Indicator efficiently processes market data. The indicator transforms input data into the frequency domain and applies a threshold to the power spectrum, filtering out noise and retaining only the frequency components that exceed the threshold.
Key aspects of the Spectral Gating Indicator include:
Adjustable Window Size: Customize the window size (ranging from 2 to 6) to control the amount of data considered during the analysis, giving you the flexibility to adapt the indicator to your trading strategy.
Complex Number Arithmetic: The indicator uses complex number addition, subtraction, and multiplication, as well as radius calculations for accurate data processing.
Iterative FFT and IFFT: The SG Indicator features iterative FFT and Inverse Fast Fourier Transform (IFFT) algorithms for rapid data analysis. The FFT algorithm converts input data into the frequency domain, while the IFFT algorithm restores the filtered data back to the time domain.
Spectral Gating: At the heart of the indicator, the spectral gating function applies a threshold to the power spectrum, suppressing frequency components below the threshold. This process helps to enhance the clarity of the data by reducing noise and focusing on the more significant frequency components.
Visualization: The indicator plots the filtered data on the chart with a simple blue line, providing a clean and easily interpretable representation of the results.
Although the Spectral Gating Indicator may not be a one-size-fits-all solution for all trading scenarios, it serves as a valuable tool for traders looking to reduce noise and concentrate on relevant market trends. By incorporating this indicator into your analysis toolkit, you can potentially make more informed trading decisions.
リリースノート
added a source オープンソーススクリプト
TradingViewの精神に則り、このスクリプトの作者はコードをオープンソースとして公開してくれました。トレーダーが内容を確認・検証できるようにという配慮です。作者に拍手を送りましょう!無料で利用できますが、コードの再公開はハウスルールに従う必要があります。
免責事項
この情報および投稿は、TradingViewが提供または推奨する金融、投資、トレード、その他のアドバイスや推奨を意図するものではなく、それらを構成するものでもありません。詳細は利用規約をご覧ください。
オープンソーススクリプト
TradingViewの精神に則り、このスクリプトの作者はコードをオープンソースとして公開してくれました。トレーダーが内容を確認・検証できるようにという配慮です。作者に拍手を送りましょう!無料で利用できますが、コードの再公開はハウスルールに従う必要があります。
免責事項
この情報および投稿は、TradingViewが提供または推奨する金融、投資、トレード、その他のアドバイスや推奨を意図するものではなく、それらを構成するものでもありません。詳細は利用規約をご覧ください。