OPEN-SOURCE SCRIPT
Magic VIBs V1

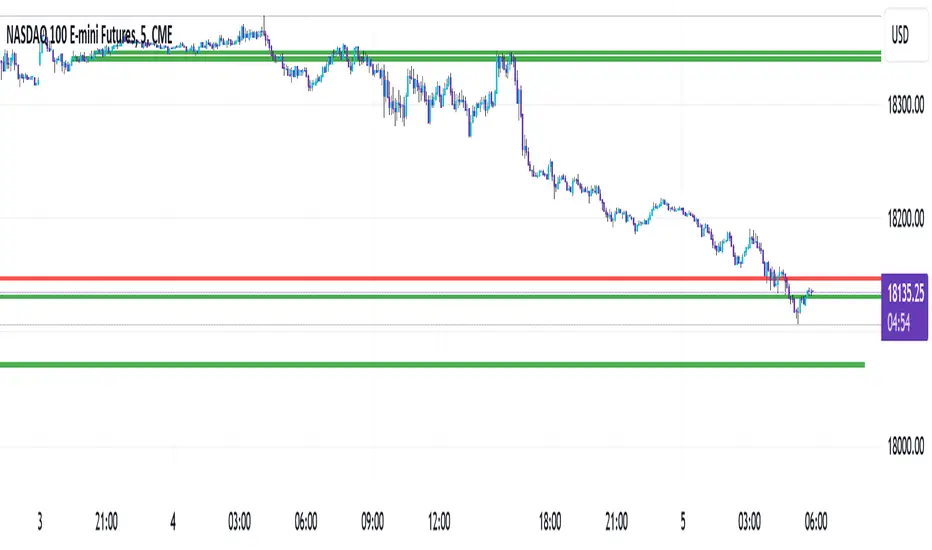
Introducing the "Magic Vib Indicator" V1 Adeed more extention so it works better on higher time frames, Plus a colour changer so now you can pick a colour for bullish and bearish
a powerful tool designed to identify and highlight unique market scenarios known as "magic volume imbalances." This indicator is specifically crafted to recognize specific candlestick patterns that have demonstrated a significant impact on price movements.
The Magic Vib Indicator is meticulously engineered to detect a particular pattern, which occurs when the high of the first candle aligns perfectly with the open of the subsequent candle, while simultaneously witnessing the close of the first candle matching the low of the second candle. These precise conditions generate what is commonly referred to as a "magic vib."
This indicator has been developed with the sole purpose of capturing these magical moments in the market. By systematically scanning and analyzing price data, it spots instances where these extraordinary price imbalances occur. Once identified, the indicator promptly marks these candles on your trading platform, providing clear visual cues for enhanced decision-making.
The Magic Vib Indicator acts as a catalyst for traders and investors, as it has proven to be a reliable precursor to significant price reactions. These marked candles act as potent signals, suggesting an impending shift in market sentiment and a high probability of substantial price movement. The resulting price action often sees significant volatility, making it an enticing opportunity for those seeking substantial gains.
However, it's important to note that while the Magic Vib Indicator offers valuable guidance, it should not be the sole basis for trading decisions. It is crucial to incorporate other technical and fundamental analysis tools, risk management strategies, and market awareness to achieve consistent success.
In summary, the Magic Vib Indicator represents a breakthrough in technical analysis, specifically tailored to identify and mark candles exhibiting the remarkable characteristics of a "magic volume imbalance." By harnessing the power of this indicator, traders can anticipate substantial price reactions, allowing them to seize opportunities and maximize their trading outcomes.
オープンソーススクリプト
TradingViewの精神に則り、このスクリプトの作者はコードをオープンソースとして公開してくれました。トレーダーが内容を確認・検証できるようにという配慮です。作者に拍手を送りましょう!無料で利用できますが、コードの再公開はハウスルールに従う必要があります。
免責事項
この情報および投稿は、TradingViewが提供または推奨する金融、投資、トレード、その他のアドバイスや推奨を意図するものではなく、それらを構成するものでもありません。詳細は利用規約をご覧ください。
オープンソーススクリプト
TradingViewの精神に則り、このスクリプトの作者はコードをオープンソースとして公開してくれました。トレーダーが内容を確認・検証できるようにという配慮です。作者に拍手を送りましょう!無料で利用できますが、コードの再公開はハウスルールに従う必要があります。
免責事項
この情報および投稿は、TradingViewが提供または推奨する金融、投資、トレード、その他のアドバイスや推奨を意図するものではなく、それらを構成するものでもありません。詳細は利用規約をご覧ください。