OPEN-SOURCE SCRIPT
Multi-Timeframe Bias by Atif Muzzammil
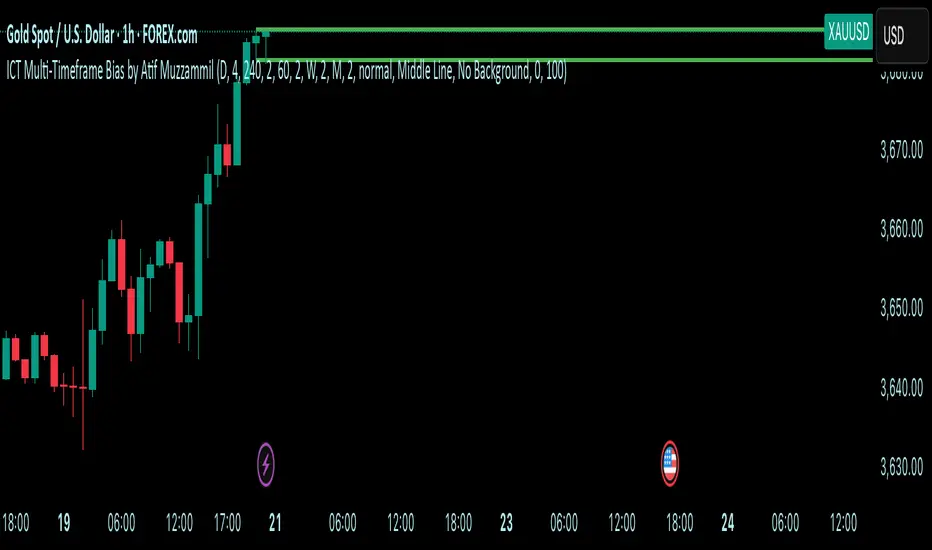
Multi-Timeframe Bias Indicator
This indicator implements multi TF bias concepts across multiple timeframes simultaneously. It identifies and displays bias levels.
Key Features:
Multi-Timeframe Analysis (Up to 5 Timeframes)
Supports all major timeframes: 5m, 15m, 30m, 1H, 4H, Daily, Weekly, Monthly
Each timeframe displays independently with customisable colors and line weights
Clean visual separation between different timeframe bias levels
ICT Bias Logic
Bearish Bias: Previous period close below the prior period's low
Bullish Bias: Previous period close above the prior period's high
Ranging Bias: Previous period close within the prior period's range
Draws horizontal lines at previous period's high and low levels
Advanced Customisation
Individual enable/disable for each timeframe
Custom colors and line thickness per timeframe
Comprehensive label settings with 4 position options
Adjustable label size, style (background/no background/text only)
Horizontal label positioning (0-100%) for optimal placement
Vertical offset controls for fine-tuning
Smart Detection
Automatic timeframe change detection using multiple methods
Enhanced detection for 4H, Weekly, and Monthly periods
Works correctly when viewing same timeframe as bias timeframe
Proper handling of market session boundaries
Clean Interface
Simple timeframe identification labels
Non-intrusive design that doesn't obstruct price action
Organized settings grouped by function
Debug mode available for troubleshooting
Compatible with all chart timeframes and works on any market that follows standard session timing.
オープンソーススクリプト
TradingViewの精神に則り、このスクリプトの作者はコードをオープンソースとして公開してくれました。トレーダーが内容を確認・検証できるようにという配慮です。作者に拍手を送りましょう!無料で利用できますが、コードの再公開はハウスルールに従う必要があります。
免責事項
この情報および投稿は、TradingViewが提供または推奨する金融、投資、トレード、その他のアドバイスや推奨を意図するものではなく、それらを構成するものでもありません。詳細は利用規約をご覧ください。
オープンソーススクリプト
TradingViewの精神に則り、このスクリプトの作者はコードをオープンソースとして公開してくれました。トレーダーが内容を確認・検証できるようにという配慮です。作者に拍手を送りましょう!無料で利用できますが、コードの再公開はハウスルールに従う必要があります。
免責事項
この情報および投稿は、TradingViewが提供または推奨する金融、投資、トレード、その他のアドバイスや推奨を意図するものではなく、それらを構成するものでもありません。詳細は利用規約をご覧ください。