OPEN-SOURCE SCRIPT
更新済 Gann Square
This indicator build by Gann Square of 19.
you select start and end of big trend in daily timeframe and calculate date range.
by draw trend line in Gann square and enter the numbers cross by line in settings input you could recognize future pivot points
remember : first) this tool worked only in daily timeframe. second) better using this in dark theme :)
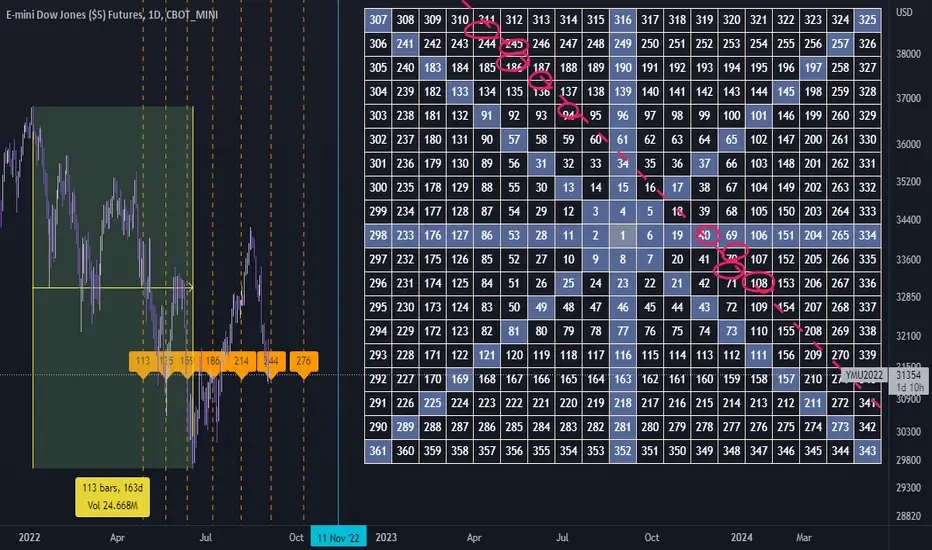
chart example :

you select start and end of big trend in daily timeframe and calculate date range.
by draw trend line in Gann square and enter the numbers cross by line in settings input you could recognize future pivot points
remember : first) this tool worked only in daily timeframe. second) better using this in dark theme :)
chart example :
リリースノート
Add color changing options for traders who like light themeオープンソーススクリプト
TradingViewの精神に則り、このスクリプトの作者はコードをオープンソースとして公開してくれました。トレーダーが内容を確認・検証できるようにという配慮です。作者に拍手を送りましょう!無料で利用できますが、コードの再公開はハウスルールに従う必要があります。
免責事項
この情報および投稿は、TradingViewが提供または推奨する金融、投資、トレード、その他のアドバイスや推奨を意図するものではなく、それらを構成するものでもありません。詳細は利用規約をご覧ください。
オープンソーススクリプト
TradingViewの精神に則り、このスクリプトの作者はコードをオープンソースとして公開してくれました。トレーダーが内容を確認・検証できるようにという配慮です。作者に拍手を送りましょう!無料で利用できますが、コードの再公開はハウスルールに従う必要があります。
免責事項
この情報および投稿は、TradingViewが提供または推奨する金融、投資、トレード、その他のアドバイスや推奨を意図するものではなく、それらを構成するものでもありません。詳細は利用規約をご覧ください。