OPEN-SOURCE SCRIPT
Trend Setter Max Bars
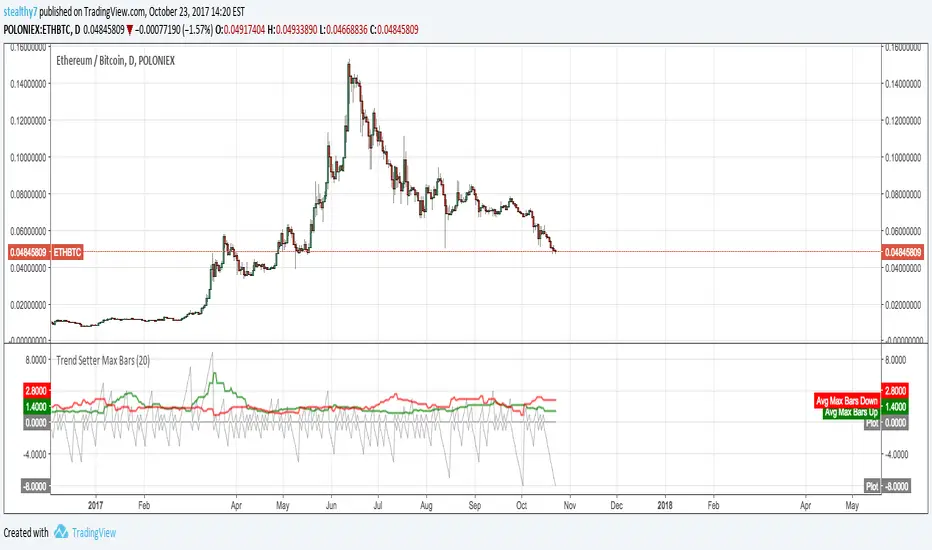
This script allows you to visualize trends. It counts continuous bars in the same direction, then makes an average of the maximum count in the look back period. If Green is above Red, its strength is upward and vice versa. This doesn't use returns or measure price moves.
*Positive Gray is current up bars count. Negative Gray down current down bars count
*Green and Red are average max counts.
This info could possibly be used to gauge trends or momentum.
Note: I finally figured out how to use loops and mutable variables in V3.
*Positive Gray is current up bars count. Negative Gray down current down bars count
*Green and Red are average max counts.
This info could possibly be used to gauge trends or momentum.
Note: I finally figured out how to use loops and mutable variables in V3.
オープンソーススクリプト
TradingViewの精神に則り、このスクリプトの作者はコードをオープンソースとして公開してくれました。トレーダーが内容を確認・検証できるようにという配慮です。作者に拍手を送りましょう!無料で利用できますが、コードの再公開はハウスルールに従う必要があります。
免責事項
この情報および投稿は、TradingViewが提供または推奨する金融、投資、トレード、その他のアドバイスや推奨を意図するものではなく、それらを構成するものでもありません。詳細は利用規約をご覧ください。
オープンソーススクリプト
TradingViewの精神に則り、このスクリプトの作者はコードをオープンソースとして公開してくれました。トレーダーが内容を確認・検証できるようにという配慮です。作者に拍手を送りましょう!無料で利用できますが、コードの再公開はハウスルールに従う必要があります。
免責事項
この情報および投稿は、TradingViewが提供または推奨する金融、投資、トレード、その他のアドバイスや推奨を意図するものではなく、それらを構成するものでもありません。詳細は利用規約をご覧ください。