OPEN-SOURCE SCRIPT
HTF Range

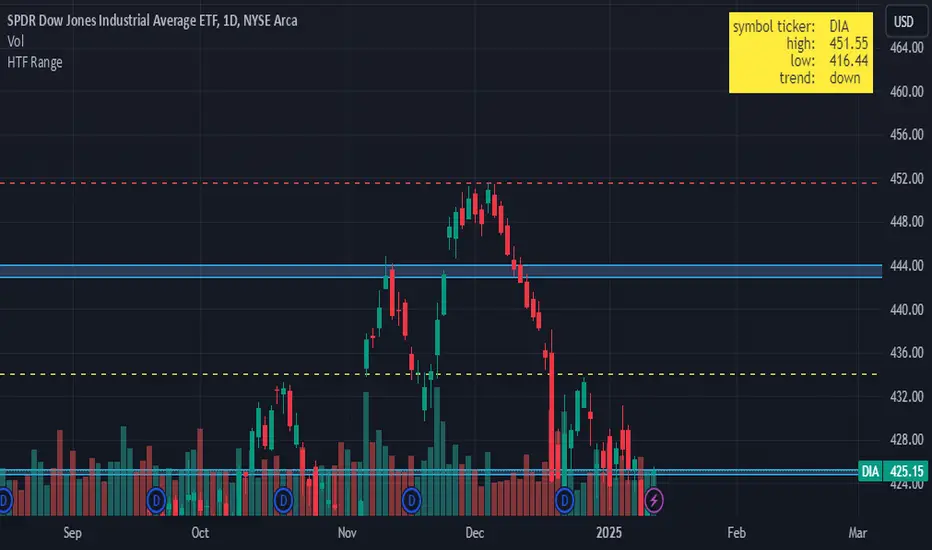
This Pine Script indicator, HTF Range, is a tool designed to help traders visualize predefined ranges (highs and lows) and analyze price action within those levels. It's particularly useful for identifying key levels and trends for a set of pre-configured assets, such as cryptocurrencies, stocks, and forex pairs.
Key Features:
1. Predefined Symbol Ranges:
2. Range Visualizations:
3. Configurable Inputs:
4. Dynamic Calculations:
5. Table Display:
Use Case:
This indicator is ideal for traders who:
Key Features:
1. Predefined Symbol Ranges:
- Stores a list of assets (tickers) with corresponding high, low, and trend information in an array.
- Automatically matches the current symbol on the chart (syminfo.ticker) to fetch and display relevant range data:
- High Range: The upper price level.
- Low Range: The lower price level.
- Trend: Indicates whether the trend is "up" or "down."
- Example tickers: BTCUSDT, ETHUSDT, GBPUSD, NVDA, and more.
2. Range Visualizations:
- Extremeties: Draws dashed horizontal lines for the high and low levels.
- Half-Level: Marks the midpoint of the range with a dashed yellow line.
- Upper and Lower Quarters: Highlights upper and lower portions of the range using shaded boxes with customizable extensions:
3. Configurable Inputs:
- Enable/Disable Levels: Toggles for extremeties, half-levels, and quarter-levels.
- Table Info: Option to display a table summarizing the range data (symbol, high, low, and trend).
4. Dynamic Calculations:
- Automatically calculates the difference between the high and low (diff) for precise range subdivisions.
- Dynamically adjusts visuals based on the trend (up or down) for better relevance to the market condition.
5. Table Display:
- Provides a detailed summary of the asset's range and trend in the top-right corner of the chart:
- Symbol ticker.
- High and low levels.
- Overall trend direction.
Use Case:
This indicator is ideal for traders who:
- Trade multiple assets and want a quick overview of key price ranges.
- Analyze price movements relative to predefined support and resistance zones.
- Use range-based strategies for trend following, breakout trading, or reversals.
オープンソーススクリプト
TradingViewの精神に則り、このスクリプトの作者はコードをオープンソースとして公開してくれました。トレーダーが内容を確認・検証できるようにという配慮です。作者に拍手を送りましょう!無料で利用できますが、コードの再公開はハウスルールに従う必要があります。
免責事項
この情報および投稿は、TradingViewが提供または推奨する金融、投資、トレード、その他のアドバイスや推奨を意図するものではなく、それらを構成するものでもありません。詳細は利用規約をご覧ください。
オープンソーススクリプト
TradingViewの精神に則り、このスクリプトの作者はコードをオープンソースとして公開してくれました。トレーダーが内容を確認・検証できるようにという配慮です。作者に拍手を送りましょう!無料で利用できますが、コードの再公開はハウスルールに従う必要があります。
免責事項
この情報および投稿は、TradingViewが提供または推奨する金融、投資、トレード、その他のアドバイスや推奨を意図するものではなく、それらを構成するものでもありません。詳細は利用規約をご覧ください。