OPEN-SOURCE SCRIPT
更新済 Map Multiple QQQ Levels to NQ (Custom Labels)
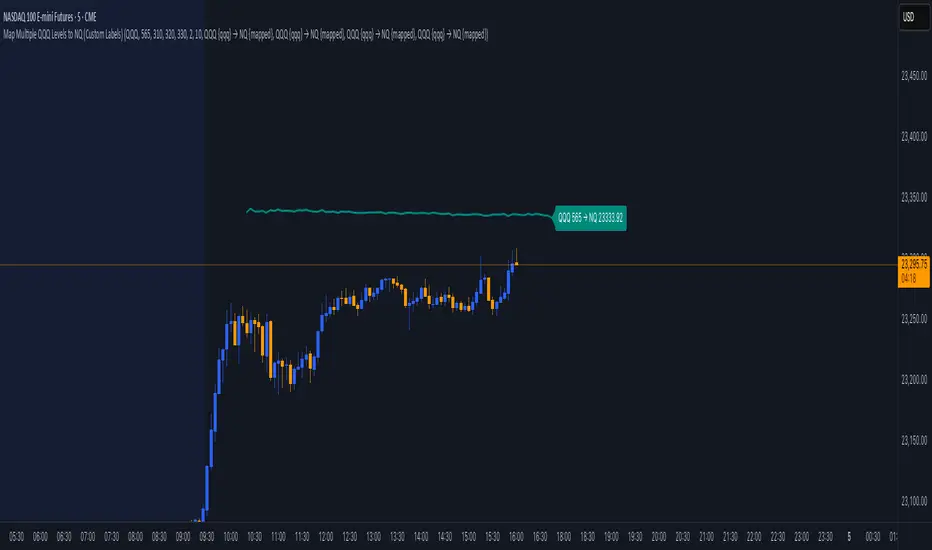
maps user-defined price levels from the QQQ (Invesco QQQ Trust, tracking the NASDAQ-100) to equivalent levels on the NQ (NASDAQ-100 futures) chart, displaying them as colored lines with optional labels. It’s designed to overlay on the NQ chart, helping traders visualize QQQ price levels in terms of NQ values based on the ratio between their prices.
Key Features:
Inputs for QQQ Levels: Users can specify up to four QQQ price levels (default: 300, 310, 320, 330) with a step of 0.1 for precision.
Customizable Appearance: Each level has its own color (default: teal, orange, purple, green) and a shared line width (default: 2).
Time Filters:
Option to display levels only for the current day (show_today_only).
Option to show levels only after 9:30 AM Eastern Time (show_after_open), aligning with market open.
Custom Labels: Each level can have a toggleable label with a customizable template (e.g., "QQQ {qqq} → NQ {mapped}"), showing the QQQ level and its mapped NQ value, formatted to two decimal places.
Dynamic Mapping: Calculates the ratio between NQ and QQQ closing prices to map QQQ levels to NQ equivalents in real-time.
Conditional Display: Levels are plotted only when user-defined conditions (day and time filters) are met, otherwise hidden (na).
Label Placement: Labels are displayed on the last confirmed historical bar, unaffected by time filters, ensuring visibility without cluttering real-time bars.
リリースノート
update chart imageリリースノート
update label distanceオープンソーススクリプト
TradingViewの精神に則り、このスクリプトの作者はコードをオープンソースとして公開してくれました。トレーダーが内容を確認・検証できるようにという配慮です。作者に拍手を送りましょう!無料で利用できますが、コードの再公開はハウスルールに従う必要があります。
免責事項
この情報および投稿は、TradingViewが提供または推奨する金融、投資、トレード、その他のアドバイスや推奨を意図するものではなく、それらを構成するものでもありません。詳細は利用規約をご覧ください。
オープンソーススクリプト
TradingViewの精神に則り、このスクリプトの作者はコードをオープンソースとして公開してくれました。トレーダーが内容を確認・検証できるようにという配慮です。作者に拍手を送りましょう!無料で利用できますが、コードの再公開はハウスルールに従う必要があります。
免責事項
この情報および投稿は、TradingViewが提供または推奨する金融、投資、トレード、その他のアドバイスや推奨を意図するものではなく、それらを構成するものでもありません。詳細は利用規約をご覧ください。