OPEN-SOURCE SCRIPT
Spread Rebalance Simulation
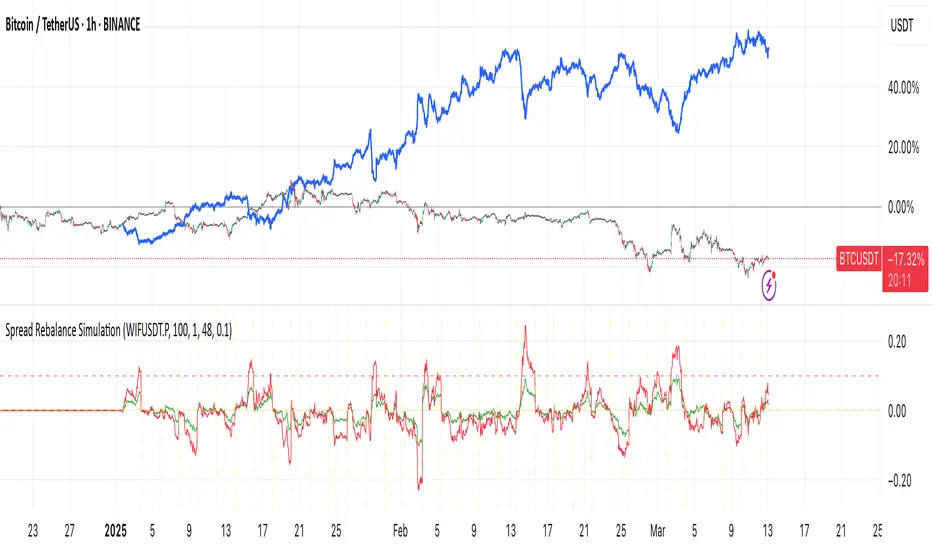
The Spread Rebalance Simulator is a tool designed to help visualize the effect of rebalancing on spread trading returns. Typically, TradingView charts are used to display spread charts, but this method assumes that the ratio remains unchanged on each bar. In real trading scenarios, the ratio constantly changes, and this indicator allows traders to see a more accurate representation of spread trading.
The next version will include support for input ratio and trading cost.
To use this simply select any chart (as a long pair) then fill the symbol name for the short pair. Then choose the rebalance period. The blue line will show you the equity of this pair combination.
The next version will include support for input ratio and trading cost.
To use this simply select any chart (as a long pair) then fill the symbol name for the short pair. Then choose the rebalance period. The blue line will show you the equity of this pair combination.
オープンソーススクリプト
TradingViewの精神に則り、このスクリプトの作者はコードをオープンソースとして公開してくれました。トレーダーが内容を確認・検証できるようにという配慮です。作者に拍手を送りましょう!無料で利用できますが、コードの再公開はハウスルールに従う必要があります。
免責事項
この情報および投稿は、TradingViewが提供または推奨する金融、投資、トレード、その他のアドバイスや推奨を意図するものではなく、それらを構成するものでもありません。詳細は利用規約をご覧ください。
オープンソーススクリプト
TradingViewの精神に則り、このスクリプトの作者はコードをオープンソースとして公開してくれました。トレーダーが内容を確認・検証できるようにという配慮です。作者に拍手を送りましょう!無料で利用できますが、コードの再公開はハウスルールに従う必要があります。
免責事項
この情報および投稿は、TradingViewが提供または推奨する金融、投資、トレード、その他のアドバイスや推奨を意図するものではなく、それらを構成するものでもありません。詳細は利用規約をご覧ください。