OPEN-SOURCE SCRIPT
更新済 Initial Balance (IB) and Previous Day / Week High, Low & Close
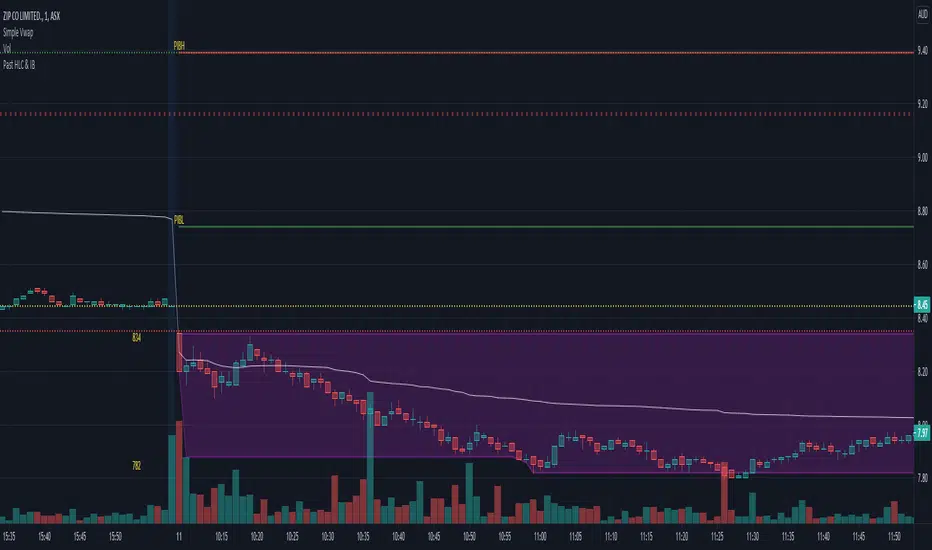
Plots Historical key levels for volume profile idea.
Plots the following:
- Previous Day High
- Previous Day Low
- Previous Day Close
- Previous Day IB High
- Previous Day IB Low
- Current Days IB High
- Current Days IB Low
IB is based on first hour of trading.
Made specifically for ASX stocks, have not tested it on other exchanges or assets.
Plots the following:
- Previous Day High
- Previous Day Low
- Previous Day Close
- Previous Day IB High
- Previous Day IB Low
- Current Days IB High
- Current Days IB Low
IB is based on first hour of trading.
Made specifically for ASX stocks, have not tested it on other exchanges or assets.
リリースノート
Fixed bugsThe indicator will now create a IB area for the current day, and shade it, and store details of previous days IB session and display it as a plot line.
Historical IB's can be switched on and viewed via settings.
IB session length can be altered in the settings.
リリースノート
Just updated how high and low is sourced for IB so that its real price, and is not effected by changing to Heikin ashi candles, or others. リリースノート
updated error in IB being updated all day rather than just IB time. リリースノート
Updated and cleaned up the IB indicatorオープンソーススクリプト
TradingViewの精神に則り、このスクリプトの作者はコードをオープンソースとして公開してくれました。トレーダーが内容を確認・検証できるようにという配慮です。作者に拍手を送りましょう!無料で利用できますが、コードの再公開はハウスルールに従う必要があります。
免責事項
この情報および投稿は、TradingViewが提供または推奨する金融、投資、トレード、その他のアドバイスや推奨を意図するものではなく、それらを構成するものでもありません。詳細は利用規約をご覧ください。
オープンソーススクリプト
TradingViewの精神に則り、このスクリプトの作者はコードをオープンソースとして公開してくれました。トレーダーが内容を確認・検証できるようにという配慮です。作者に拍手を送りましょう!無料で利用できますが、コードの再公開はハウスルールに従う必要があります。
免責事項
この情報および投稿は、TradingViewが提供または推奨する金融、投資、トレード、その他のアドバイスや推奨を意図するものではなく、それらを構成するものでもありません。詳細は利用規約をご覧ください。