OPEN-SOURCE SCRIPT
ATH/TTL & 52WH/L with Candle Coloring by RV
Importance:
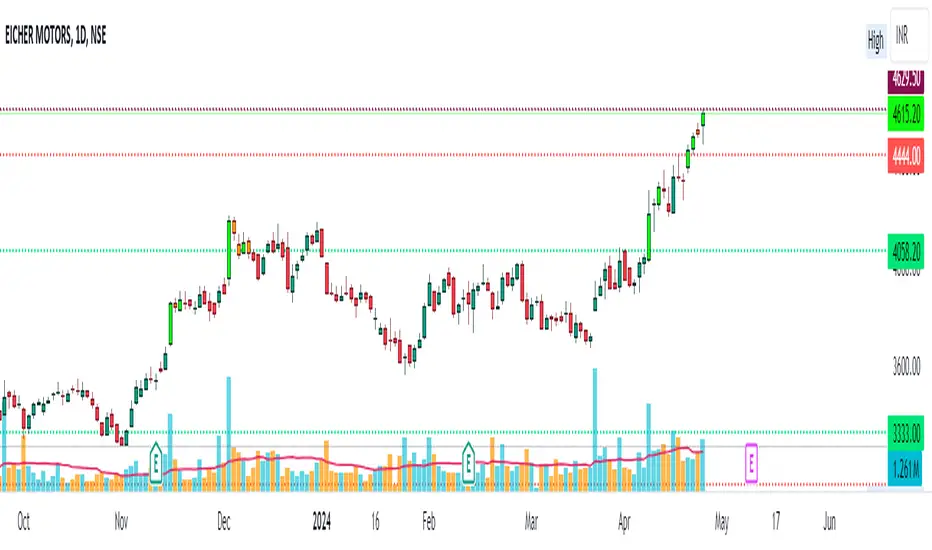
Identifying Key Price Levels: The indicator helps identify critical price levels such as all-time highs (ATH), all-time lows (ATL), 52-week highs (52WH), and 52-week lows (52WL). These levels often act as significant support or resistance areas.
Candle Color Insights: By coloring candles based on their relationship to these key levels, traders can quickly assess market sentiment and potential reversal points.
Visual Representation: The plotted lines and colored candles provide a visual representation of price dynamics, aiding in trend analysis and decision-making.
How to Use:
Key Level Confirmation: Confirm market trends or reversals by observing how price interacts with ATH, ATL, 52WH, and 52WL levels. Breakouts or bounces from these levels can signal strong buying or selling pressure.
Candle Color Signals: Pay attention to candle colors near key levels. For example, green candles above 52WH may indicate bullish momentum, while red candles below 52WL may suggest bearish pressure.
Confirmation with Other Indicators: Use this indicator in conjunction with other technical indicators or chart patterns to validate trading signals. For instance, combine it with moving averages or RSI to confirm potential entry or exit points.
Risk Management: Set stop-loss orders or take-profit levels based on the proximity of price to key levels. Tighten stops or consider profit-taking near significant levels to manage risk effectively.
Lines Plotted:
ATH Line: Represents the all-time high (ATH) levels.
ATL Line: Represents the all-time low (ATL) levels.
52WH Line: Represents the 52-week high (52WH) levels.
52WL Line: Represents the 52-week low (52WL) levels.
52WH 25% Low Line: Represents 25% below the 52-week high.
52WL 30% High Line: Represents 30% above the 52-week low.
Candle Coloring:
Candles are colored based on their relationship to ATH, ATL, 52WH, and 52WL levels.
Green: Close is above 52WH.
Orange: Close is above 52WH but lower than or equal to open.
Red: Close is below 52WL.
Cyan: Close is below 52WL but higher than or equal to open.
Additional Information:
Levels for coloring candles are dynamically calculated based on percentage differences from 52WH and 52WL.
Historical data is fetched to calculate ATH, ATL, 52WH, and 52WL levels.
The script provides a visual representation of key price levels and candle behavior relative to these levels.
オープンソーススクリプト
TradingViewの精神に則り、このスクリプトの作者はコードをオープンソースとして公開してくれました。トレーダーが内容を確認・検証できるようにという配慮です。作者に拍手を送りましょう!無料で利用できますが、コードの再公開はハウスルールに従う必要があります。
免責事項
この情報および投稿は、TradingViewが提供または推奨する金融、投資、トレード、その他のアドバイスや推奨を意図するものではなく、それらを構成するものでもありません。詳細は利用規約をご覧ください。
オープンソーススクリプト
TradingViewの精神に則り、このスクリプトの作者はコードをオープンソースとして公開してくれました。トレーダーが内容を確認・検証できるようにという配慮です。作者に拍手を送りましょう!無料で利用できますが、コードの再公開はハウスルールに従う必要があります。
免責事項
この情報および投稿は、TradingViewが提供または推奨する金融、投資、トレード、その他のアドバイスや推奨を意図するものではなく、それらを構成するものでもありません。詳細は利用規約をご覧ください。