INVITE-ONLY SCRIPT
更新済 Ghost Vision I
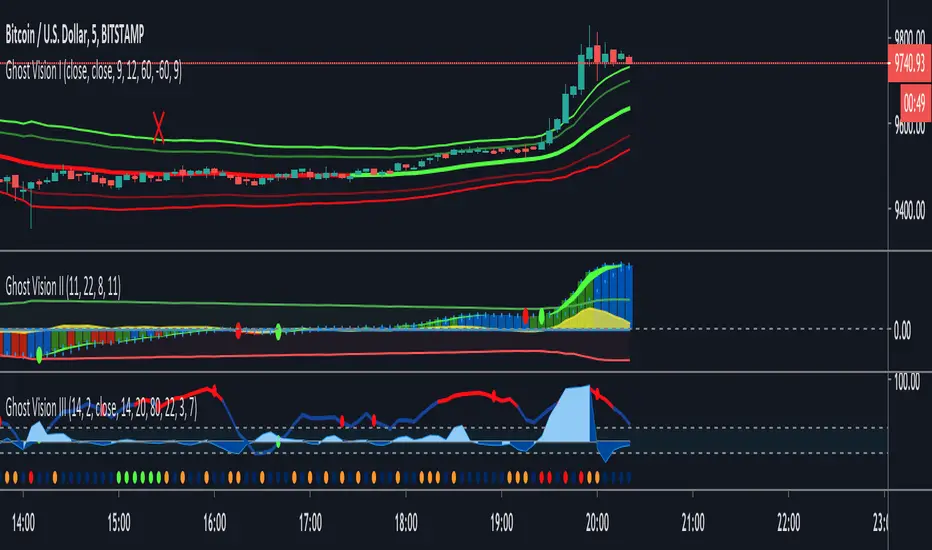
Channels indicate the extreme of the price movement compared to normal movement, a middle line indicates the current trend direction — green for bullish and red for bearish.
Divergences with price are displayed with H — for hidden, and R-for regular likewise green or red for bullish or bearish.
GhostVision I — Will help you to answer the following questions:
Is that price movement has power behind it or it’s just a divergence?
Is the current price is valued fairly or is it extreme?
Is it a good time to enter a position?
Where should I take profit?
Where should put my stop loss?
リリースノート
The new addition of danger zone feature & minor improvements.リリースノート
Fixing a problem caused by the "max_bars_back" error, now all time frames should work as they should.リリースノート
Added my favorite scalping tools on top of GV1 by default so you can have them all at once with one indicator (VWAP, EMA9)- VWAP: Use it for support/resistance and direction of the day
- EMA9: Great for existing a scalp trade before the market turns
- Especially for 5/25min time frame
Blog post on how to use it for day trading coming soon!
(if you're swing trading you can turn it off in the settings)
リリースノート
Added alerts for Danger Zone and Divergences, Don't miss important indications anymore.招待専用スクリプト
このスクリプトは作者が承認したユーザーのみアクセス可能です。使用するにはアクセス申請をして許可を得る必要があります。通常は支払い後に承認されます。詳細は下記の作者の指示に従うか、GhostVisionに直接お問い合わせください。
TradingViewは、作者を完全に信頼し、スクリプトの動作を理解していない限り、有料スクリプトの購入・使用を推奨しません。コミュニティスクリプトには無料のオープンソースの代替が多数あります。
作者の指示
免責事項
この情報および投稿は、TradingViewが提供または推奨する金融、投資、トレード、その他のアドバイスや推奨を意図するものではなく、それらを構成するものでもありません。詳細は利用規約をご覧ください。
招待専用スクリプト
このスクリプトは作者が承認したユーザーのみアクセス可能です。使用するにはアクセス申請をして許可を得る必要があります。通常は支払い後に承認されます。詳細は下記の作者の指示に従うか、GhostVisionに直接お問い合わせください。
TradingViewは、作者を完全に信頼し、スクリプトの動作を理解していない限り、有料スクリプトの購入・使用を推奨しません。コミュニティスクリプトには無料のオープンソースの代替が多数あります。
作者の指示
免責事項
この情報および投稿は、TradingViewが提供または推奨する金融、投資、トレード、その他のアドバイスや推奨を意図するものではなく、それらを構成するものでもありません。詳細は利用規約をご覧ください。