OPEN-SOURCE SCRIPT
更新済 Dynamic Intraday HLC levels [Sudeb]

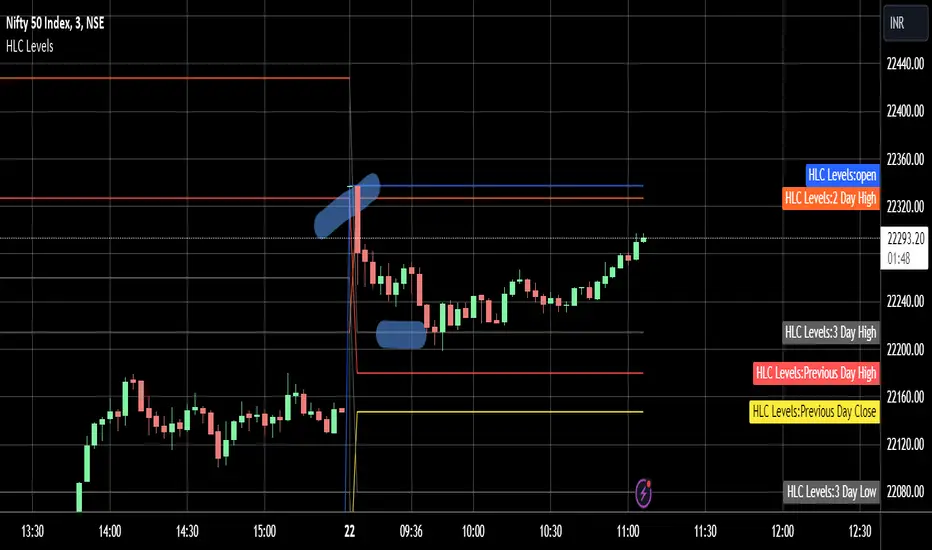
This is a simple indicator which will mark High & Low of last three days.
Close of Previous Day
The High lines will show in RED color, Low lines in green & close lines in Yellow.
The advantage of using this indicator is - It will greyed out or fade the color of any previous day level if the price is breached of that level.
For example if 2 day's ago High price is breached by 1 day's ago High, then the 2 Day's ago High level color will greyed out in current day chart. Thus giving you a confirmation whether it's a fresh or already tested levels.
リリースノート
Few code modifications have been made. リリースノート
Few code updates have been made. オープンソーススクリプト
TradingViewの精神に則り、このスクリプトの作者はコードをオープンソースとして公開してくれました。トレーダーが内容を確認・検証できるようにという配慮です。作者に拍手を送りましょう!無料で利用できますが、コードの再公開はハウスルールに従う必要があります。
免責事項
この情報および投稿は、TradingViewが提供または推奨する金融、投資、トレード、その他のアドバイスや推奨を意図するものではなく、それらを構成するものでもありません。詳細は利用規約をご覧ください。
オープンソーススクリプト
TradingViewの精神に則り、このスクリプトの作者はコードをオープンソースとして公開してくれました。トレーダーが内容を確認・検証できるようにという配慮です。作者に拍手を送りましょう!無料で利用できますが、コードの再公開はハウスルールに従う必要があります。
免責事項
この情報および投稿は、TradingViewが提供または推奨する金融、投資、トレード、その他のアドバイスや推奨を意図するものではなく、それらを構成するものでもありません。詳細は利用規約をご覧ください。