OPEN-SOURCE SCRIPT
Candle and BG Trend Identifier
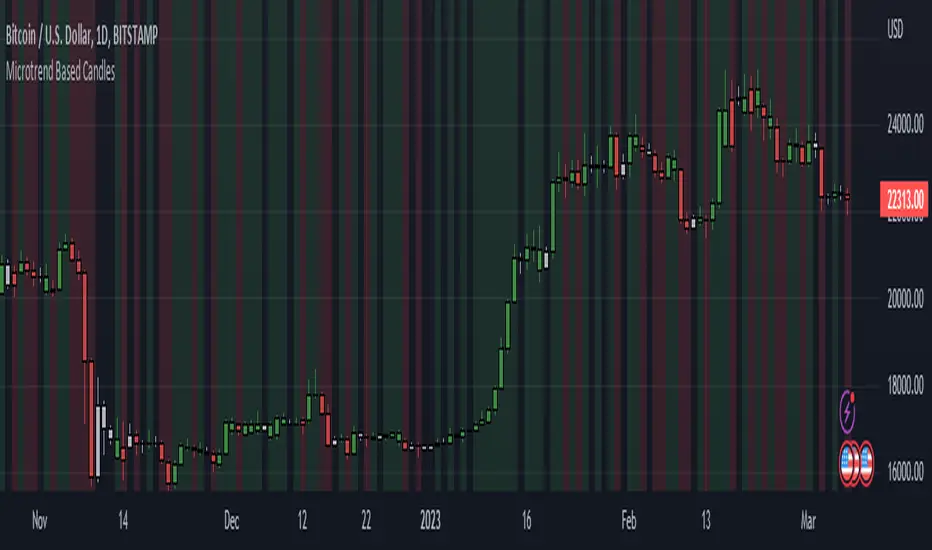
This indicator simply changes the background and color of candle based on the previous candle's close. If a candle closes high than the previous candle's high it will be indicated via green coloring. If a candle closes lower than the previous candle's low it will be indicated in red coloring. Additionally, grey colored candles appear when neither occur - often signifying consolidation.
These candles can be used to identify previous small lasting and long ranging trends. Areas that are heavily saturated with one specific color will likely indicate a trend.
If you are not able to see the colored candles, disable your main candle overlay in the top left by clicking on the eye icon.
These candles can be used to identify previous small lasting and long ranging trends. Areas that are heavily saturated with one specific color will likely indicate a trend.
If you are not able to see the colored candles, disable your main candle overlay in the top left by clicking on the eye icon.
オープンソーススクリプト
TradingViewの精神に則り、このスクリプトの作者はコードをオープンソースとして公開してくれました。トレーダーが内容を確認・検証できるようにという配慮です。作者に拍手を送りましょう!無料で利用できますが、コードの再公開はハウスルールに従う必要があります。
免責事項
この情報および投稿は、TradingViewが提供または推奨する金融、投資、トレード、その他のアドバイスや推奨を意図するものではなく、それらを構成するものでもありません。詳細は利用規約をご覧ください。
オープンソーススクリプト
TradingViewの精神に則り、このスクリプトの作者はコードをオープンソースとして公開してくれました。トレーダーが内容を確認・検証できるようにという配慮です。作者に拍手を送りましょう!無料で利用できますが、コードの再公開はハウスルールに従う必要があります。
免責事項
この情報および投稿は、TradingViewが提供または推奨する金融、投資、トレード、その他のアドバイスや推奨を意図するものではなく、それらを構成するものでもありません。詳細は利用規約をご覧ください。