PROTECTED SOURCE SCRIPT
Instant RSI Divergence
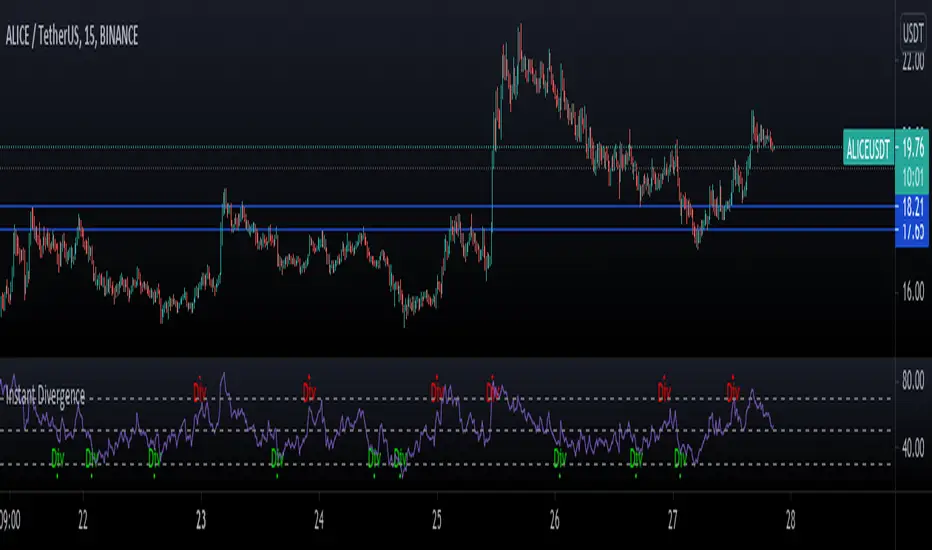
This script uses RSI Highs and Lows along with measuring price actions Highs and lows to find Divergences instantly.
The common problem when doing this is that you end up with signals all over the place if you dont use the pivot finder as confirmation however I have found a way to avoid this problem.
Since there extra bars to confirm whether price are making pivot highs or not, you can end up with some signals which are invalidated a few bars later.
The Green Divs are showing Bullish divergence and the Red Divs are showing bearish divergence.
You can use this with other indicators to mark up more levels of confluence to confirm trade entries.
保護スクリプト
このスクリプトのソースコードは非公開で投稿されています。 ただし、制限なく自由に使用できます – 詳細はこちらでご確認ください。
免責事項
この情報および投稿は、TradingViewが提供または推奨する金融、投資、トレード、その他のアドバイスや推奨を意図するものではなく、それらを構成するものでもありません。詳細は利用規約をご覧ください。
保護スクリプト
このスクリプトのソースコードは非公開で投稿されています。 ただし、制限なく自由に使用できます – 詳細はこちらでご確認ください。
免責事項
この情報および投稿は、TradingViewが提供または推奨する金融、投資、トレード、その他のアドバイスや推奨を意図するものではなく、それらを構成するものでもありません。詳細は利用規約をご覧ください。