OPEN-SOURCE SCRIPT
200WMA Screener
Description:
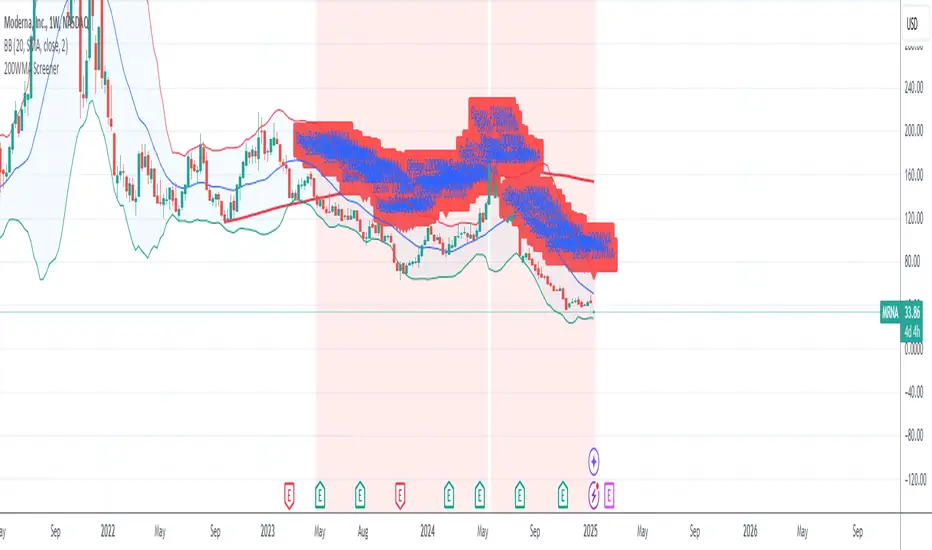
This custom indicator helps identify stocks trading below their 200-week moving average (200WMA), a key technical indicator often used to analyze long-term trends. The script calculates the 200WMA using weekly close prices and provides the following features:
Visual Plot: Displays the 200WMA as a smooth line on the chart for easy trend analysis.
Background Highlight: Automatically highlights the chart background when the current price is below the 200WMA, signaling a potential bearish trend or undervalued stock.
Alert System: Includes an alert condition to notify you when a stock trades below its 200WMA, so you never miss an opportunity.
Compatibility: Works across all assets (stocks, forex, crypto) and automatically adapts to the selected ticker.
This script is ideal for traders and investors looking for long-term opportunities, identifying potential trend reversals, or spotting undervalued stocks.
オープンソーススクリプト
TradingViewの精神に則り、このスクリプトの作者はコードをオープンソースとして公開してくれました。トレーダーが内容を確認・検証できるようにという配慮です。作者に拍手を送りましょう!無料で利用できますが、コードの再公開はハウスルールに従う必要があります。
免責事項
この情報および投稿は、TradingViewが提供または推奨する金融、投資、トレード、その他のアドバイスや推奨を意図するものではなく、それらを構成するものでもありません。詳細は利用規約をご覧ください。
オープンソーススクリプト
TradingViewの精神に則り、このスクリプトの作者はコードをオープンソースとして公開してくれました。トレーダーが内容を確認・検証できるようにという配慮です。作者に拍手を送りましょう!無料で利用できますが、コードの再公開はハウスルールに従う必要があります。
免責事項
この情報および投稿は、TradingViewが提供または推奨する金融、投資、トレード、その他のアドバイスや推奨を意図するものではなく、それらを構成するものでもありません。詳細は利用規約をご覧ください。