OPEN-SOURCE SCRIPT
3 EMA/SMA + Colored Candles[C2Trends]
// Indicator Features:
// 1) 3 Exponential Moving Averages and 3 Simple Moving Averages.
// 2) Additional EMA input for colored candles(EMA is hidden from chart, input used for coloring of candles only)
// 3) Turn colored candles on/off from main input tab of indicator settings.
// 4) Turn SMA's and EMA's on/off from main input tab of indicator settings.
// 5) Select single color or 2 color EMA and SMA lines from main input tab of indicator settings.
// Indicator Notes:
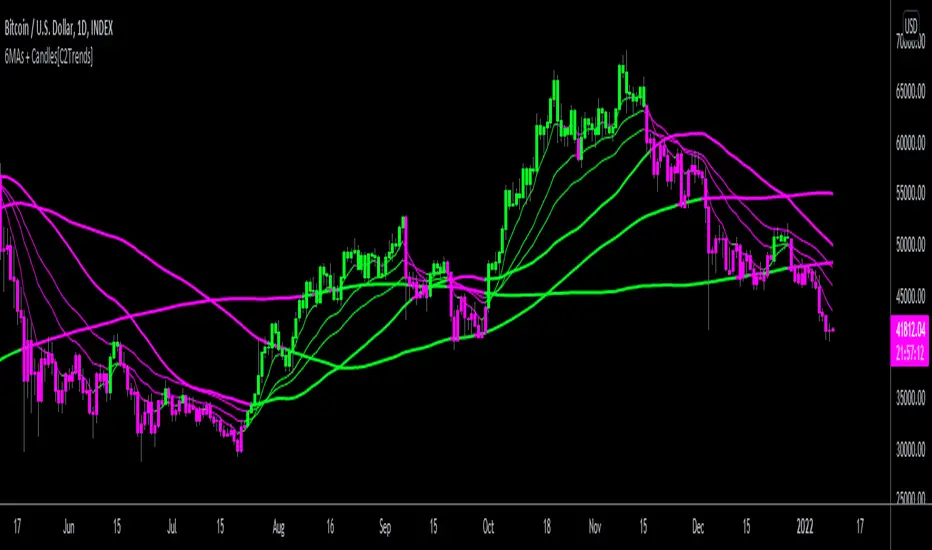
// 1) 'Candle EMA' input is the trend lookback period for the price candle colors. When price is above desired Candle EMA, price candles will color green. When price is below the Candle EMA, price candles will color fuchsia.
// 2) If you are using another indicator that colors the price candles it may overlap the candle colors applied by this indicator. Trying hiding or removing other indicators to troubleshoot if having candle color issues.
// 3) Using 2-color price moving averages: when price is above an average the average will color green, when price is below an average the average will color fuchsia.
// 1) 3 Exponential Moving Averages and 3 Simple Moving Averages.
// 2) Additional EMA input for colored candles(EMA is hidden from chart, input used for coloring of candles only)
// 3) Turn colored candles on/off from main input tab of indicator settings.
// 4) Turn SMA's and EMA's on/off from main input tab of indicator settings.
// 5) Select single color or 2 color EMA and SMA lines from main input tab of indicator settings.
// Indicator Notes:
// 1) 'Candle EMA' input is the trend lookback period for the price candle colors. When price is above desired Candle EMA, price candles will color green. When price is below the Candle EMA, price candles will color fuchsia.
// 2) If you are using another indicator that colors the price candles it may overlap the candle colors applied by this indicator. Trying hiding or removing other indicators to troubleshoot if having candle color issues.
// 3) Using 2-color price moving averages: when price is above an average the average will color green, when price is below an average the average will color fuchsia.
オープンソーススクリプト
TradingViewの精神に則り、このスクリプトの作者はコードをオープンソースとして公開してくれました。トレーダーが内容を確認・検証できるようにという配慮です。作者に拍手を送りましょう!無料で利用できますが、コードの再公開はハウスルールに従う必要があります。
免責事項
この情報および投稿は、TradingViewが提供または推奨する金融、投資、トレード、その他のアドバイスや推奨を意図するものではなく、それらを構成するものでもありません。詳細は利用規約をご覧ください。
オープンソーススクリプト
TradingViewの精神に則り、このスクリプトの作者はコードをオープンソースとして公開してくれました。トレーダーが内容を確認・検証できるようにという配慮です。作者に拍手を送りましょう!無料で利用できますが、コードの再公開はハウスルールに従う必要があります。
免責事項
この情報および投稿は、TradingViewが提供または推奨する金融、投資、トレード、その他のアドバイスや推奨を意図するものではなく、それらを構成するものでもありません。詳細は利用規約をご覧ください。