OPEN-SOURCE SCRIPT
A.P.E Quarter Pts
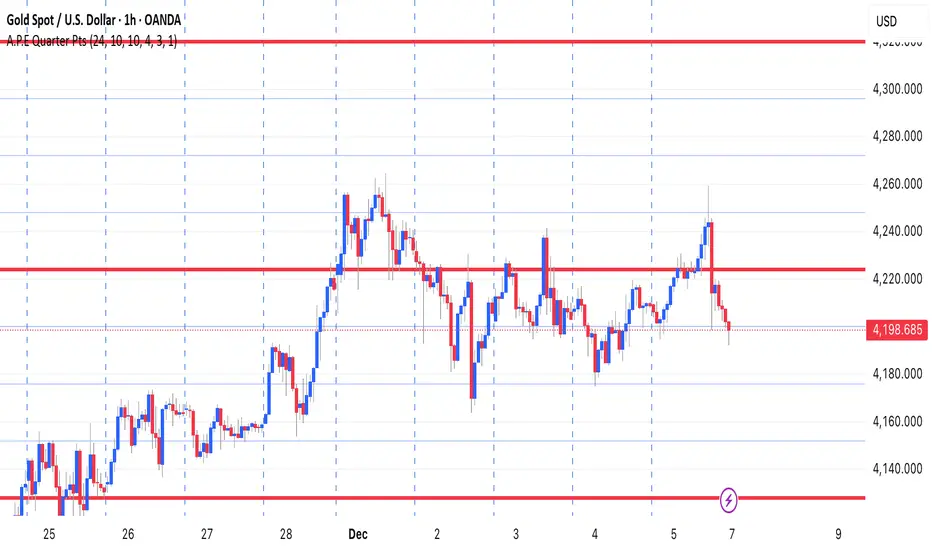
This indicator draws a set of straight horizontal price levels on your chart.
Each line is spaced evenly apart at a distance you choose — these are called quarter-points.
As price moves, the grid of lines stays centered around the current price, so you always see the nearest support and resistance levels. The lines above price show possible resistance, and the lines below price show possible support.
Some of the lines can be drawn thicker or in a stronger color to show more important levels.
Overall, the indicator gives you a clean, easy-to-read structure of evenly spaced levels that help you see where price may react, stall, bounce, or reverse.
オープンソーススクリプト
TradingViewの精神に則り、このスクリプトの作者はコードをオープンソースとして公開してくれました。トレーダーが内容を確認・検証できるようにという配慮です。作者に拍手を送りましょう!無料で利用できますが、コードの再公開はハウスルールに従う必要があります。
免責事項
この情報および投稿は、TradingViewが提供または推奨する金融、投資、トレード、その他のアドバイスや推奨を意図するものではなく、それらを構成するものでもありません。詳細は利用規約をご覧ください。
オープンソーススクリプト
TradingViewの精神に則り、このスクリプトの作者はコードをオープンソースとして公開してくれました。トレーダーが内容を確認・検証できるようにという配慮です。作者に拍手を送りましょう!無料で利用できますが、コードの再公開はハウスルールに従う必要があります。
免責事項
この情報および投稿は、TradingViewが提供または推奨する金融、投資、トレード、その他のアドバイスや推奨を意図するものではなく、それらを構成するものでもありません。詳細は利用規約をご覧ください。