OPEN-SOURCE SCRIPT
MA Direction Histogram
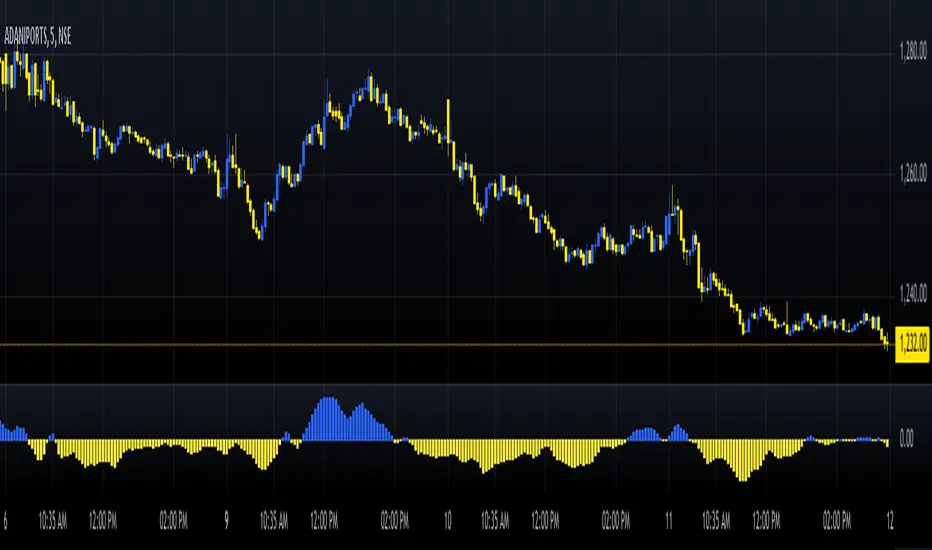
The MA Direction Histogram is a simple yet powerful tool for visualizing the momentum of a moving average (MA). It highlights whether the MA is trending up or down, making it ideal for identifying market direction quickly.
Key Features:
1. Custom MA Options: Choose from SMA, EMA, WMA, VWMA, or HMA for flexible analysis.
2. Momentum Visualization: Bars show the difference between the MA and its value from a lookback period.
- Blue Bars: Upward momentum.
- Yellow Bars: Downward momentum.
3. Easy Customization: Adjust the MA length, lookback period, and data source.
How to Use:
- Confirm Trends: Positive bars indicate uptrends; negative bars suggest downtrends.
- *Spot Reversals: Look for bar color changes as potential reversal signals.
Compact, intuitive, and versatile, the "MA Direction Histogram" helps traders stay aligned with market momentum. Perfect for trend-based strategies!
オープンソーススクリプト
TradingViewの精神に則り、このスクリプトの作者はコードをオープンソースとして公開してくれました。トレーダーが内容を確認・検証できるようにという配慮です。作者に拍手を送りましょう!無料で利用できますが、コードの再公開はハウスルールに従う必要があります。
免責事項
この情報および投稿は、TradingViewが提供または推奨する金融、投資、トレード、その他のアドバイスや推奨を意図するものではなく、それらを構成するものでもありません。詳細は利用規約をご覧ください。
オープンソーススクリプト
TradingViewの精神に則り、このスクリプトの作者はコードをオープンソースとして公開してくれました。トレーダーが内容を確認・検証できるようにという配慮です。作者に拍手を送りましょう!無料で利用できますが、コードの再公開はハウスルールに従う必要があります。
免責事項
この情報および投稿は、TradingViewが提供または推奨する金融、投資、トレード、その他のアドバイスや推奨を意図するものではなく、それらを構成するものでもありません。詳細は利用規約をご覧ください。