OPEN-SOURCE SCRIPT
更新済 123 Trend Continuation Pattern
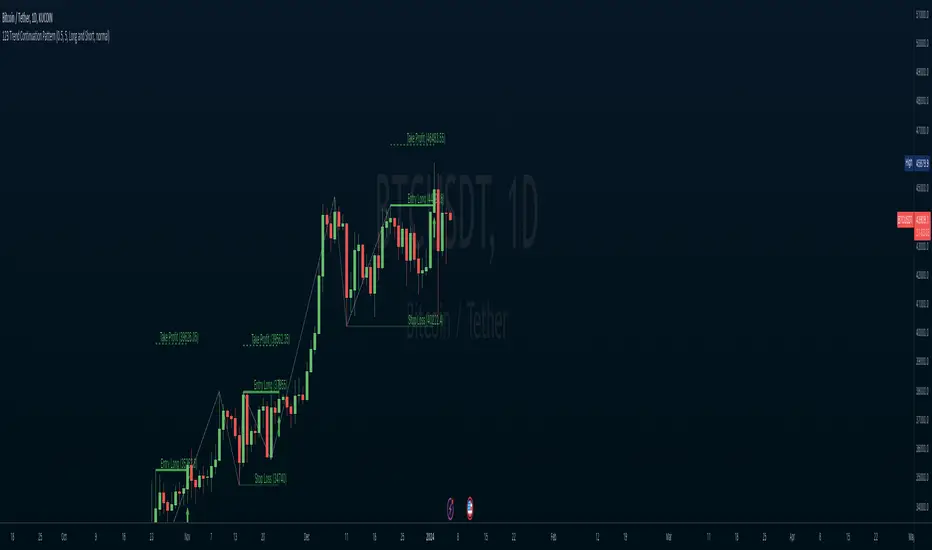
This simple indicator will help identify the 123 Patterns on the charts. It's build based on the zigzag indicator, which will work as a guideline to identify the 3 points. As soon as the price crosses the third point, the indicator will draw 3 lines: entry, take profit, and stop loss. Those lines will work as a reference and may help with other indicators. This kind of analysis will work on any time frame and symbol, but those markets that have high volatility may have better result
リリースノート
- Converted to pine script 5
- Fixed some texts
- Added alert condition
リリースノート
Added max lines and max labels to show more details on past dataリリースノート
Removed max bars back parameterAdded the option to change the text size
added the option to change the take profit and stop loss levels colors
added an option to use close value of the candle instead of the high/low values
added alerts when the price crosses the latest take profits and stop losses
added the values on the take profits, stop losses and entries labels
オープンソーススクリプト
TradingViewの精神に則り、このスクリプトの作者はコードをオープンソースとして公開してくれました。トレーダーが内容を確認・検証できるようにという配慮です。作者に拍手を送りましょう!無料で利用できますが、コードの再公開はハウスルールに従う必要があります。
免責事項
この情報および投稿は、TradingViewが提供または推奨する金融、投資、トレード、その他のアドバイスや推奨を意図するものではなく、それらを構成するものでもありません。詳細は利用規約をご覧ください。
オープンソーススクリプト
TradingViewの精神に則り、このスクリプトの作者はコードをオープンソースとして公開してくれました。トレーダーが内容を確認・検証できるようにという配慮です。作者に拍手を送りましょう!無料で利用できますが、コードの再公開はハウスルールに従う必要があります。
免責事項
この情報および投稿は、TradingViewが提供または推奨する金融、投資、トレード、その他のアドバイスや推奨を意図するものではなく、それらを構成するものでもありません。詳細は利用規約をご覧ください。