OPEN-SOURCE SCRIPT
更新済 Market Monitor
Overview
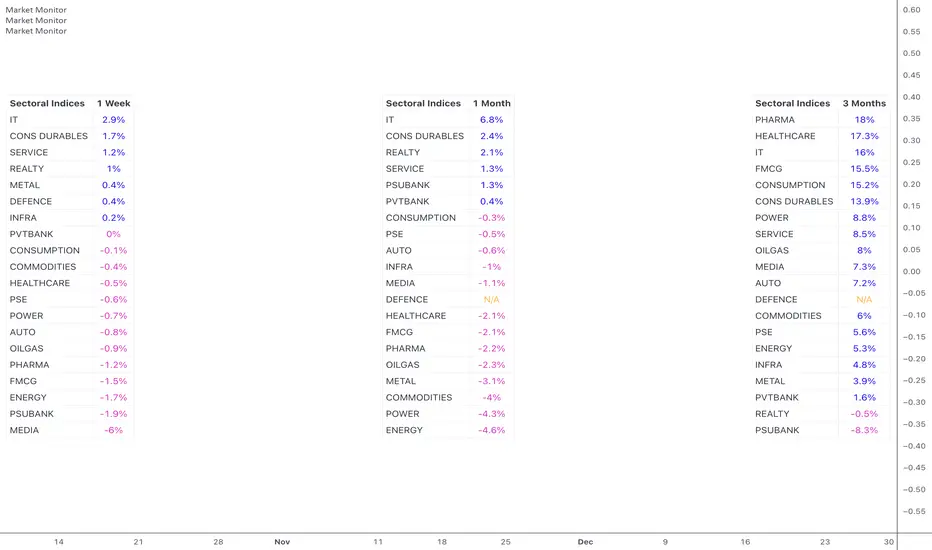
The Market Monitor Indicator provides a customisable view of dynamic percentage changes across selected indices or sectors, calculated by comparing current and previous closing prices over the chosen timeframe.
Key Features

Customisation
Use Cases
The Market Monitor Indicator provides a customisable view of dynamic percentage changes across selected indices or sectors, calculated by comparing current and previous closing prices over the chosen timeframe.
Key Features
- Choose up to 20 predefined indices or your own selected indices/stocks.
- Use checkboxes to show or hide individual entries.
- Monitor returns over daily, weekly, monthly, quarterly, half-yearly, or yearly timeframes
- Sort by returns (descending) to quickly identify top-performing indices or alphabetically for an organised and systematic review.
Customisation
- Switch between Light Mode (Blue or Green themes) and Dark Mode for visual clarity.
- Adjust the table’s size, position, and location.
- Customise the table title to your own choice e.g. Sectoral, Broad, Portfolio etc.
Use Cases
- Use multiple instances of the script with varying timeframes to study sectoral rotation and trends.
- Customise the stocks to see your portfolio returns for the day or over the past week, or longer.
リリースノート
- Option to give custom titles to chosen indices. Can be used when a spread of stocks is used to create a custom index.
- Ascending sorting also added.
- Alphabetical sorting disabled for custom titles.
リリースノート
- The script can now be shifted horizontally using a custom offfset value. This allows us more than 3 iterations of the table on one chart using multiple script instances.
- Alphabetical sorting is now possible in custom names too.
オープンソーススクリプト
TradingViewの精神に則り、このスクリプトの作者はコードをオープンソースとして公開してくれました。トレーダーが内容を確認・検証できるようにという配慮です。作者に拍手を送りましょう!無料で利用できますが、コードの再公開はハウスルールに従う必要があります。
免責事項
この情報および投稿は、TradingViewが提供または推奨する金融、投資、トレード、その他のアドバイスや推奨を意図するものではなく、それらを構成するものでもありません。詳細は利用規約をご覧ください。
オープンソーススクリプト
TradingViewの精神に則り、このスクリプトの作者はコードをオープンソースとして公開してくれました。トレーダーが内容を確認・検証できるようにという配慮です。作者に拍手を送りましょう!無料で利用できますが、コードの再公開はハウスルールに従う必要があります。
免責事項
この情報および投稿は、TradingViewが提供または推奨する金融、投資、トレード、その他のアドバイスや推奨を意図するものではなく、それらを構成するものでもありません。詳細は利用規約をご覧ください。