OPEN-SOURCE SCRIPT
更新済 Daily Historical Volatility StdDev Levels
Description:
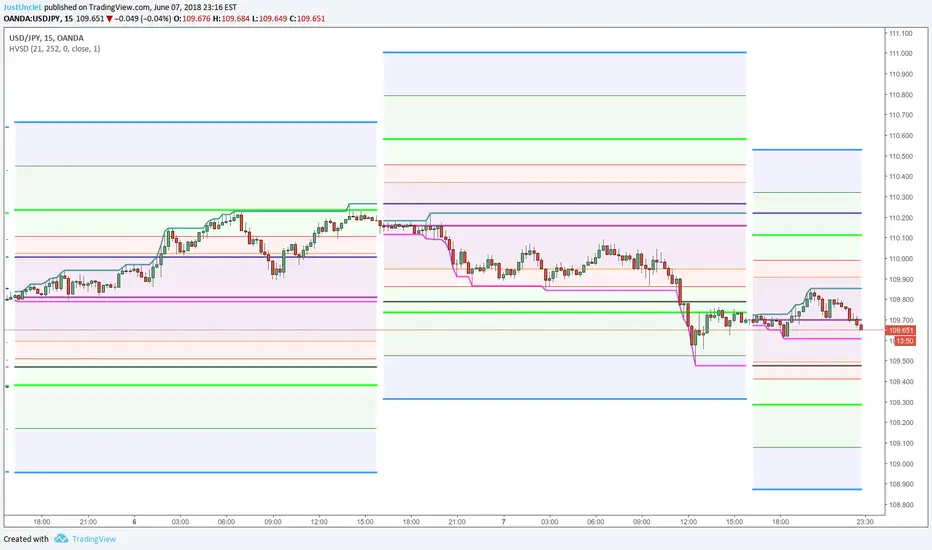
This indicator plots Daily Standard deviation levels on price chart based on Historical Volatility (HV). It uses the most common approach for calculating historical volatility as standard deviation of logarithmic returns, based on daily closing/settlement prices.
Assets: Currency Pairs, Commodities, also works on stocks, some indices.
Time Frames: 5min to 60min. This will also work on Daily Chart, by setting "DaystoExpire" to 21
Options:
References:
This indicator plots Daily Standard deviation levels on price chart based on Historical Volatility (HV). It uses the most common approach for calculating historical volatility as standard deviation of logarithmic returns, based on daily closing/settlement prices.
Assets: Currency Pairs, Commodities, also works on stocks, some indices.
Time Frames: 5min to 60min. This will also work on Daily Chart, by setting "DaystoExpire" to 21
Options:
- Use Daily Data to Calculate StdDev HV (default), otherwise use the charts Time Frame
- Lookback = number of days/periods to calculate stddev of HV (21 by default)
- Annual = number of trading days in a calender year (252 by default)
- Days to Expiry = number of days for the life of this option ( for auto calculation
this is 1 for intraday, 21 for daily and annual when chart TF used) - Settlement Source = close price by default, can use another source.
- Settlement Volume Weighted Average Length = by setting this to >1 then an average
is used for settlement. - Display ### Standard Deviation Levels = select what levels are to be displayed.
References:
- How To Use Standard Deviation In Your Trading Day: https://www.youtube.com/watch?v=i28w9HBmJdQ&feature=youtu.be
- Deviation Levels Indicator: [url= youtube.com/watch?v=EjHDNIKQH5k&feature=youtu.be]youtube.com/watch?v=EjHDNIKQH5k&feature=youtu.be
- http://www.macroption.com/historical-volatility-calculation/
- Historical Volatility based Standard Deviation_V2 by ucsgears
- Historical Volatility Strategy by Hpotter
リリースノート
Corrected Change of day detection for Intraday TFsCorrected -0.75 Label.
リリースノート
Small changes:- Changed to only display background fill for upto +/- 1 Stddev.
- Added option to Display Todays Only Levels.
リリースノート
...- Made changes so that it also work with Renko Charts, BUT only works well with short TF (<=5min) and brick (<=6pip).
- Added Option to display Previous Day's High Low Levels.
- Added Option to display Current Day's High Low Levels.
- Changed 0.75 level to 0.7 level.
- Shortened short title to "HVSD" for easier visual when Indicator Labels are used.
リリースノート
...- Modified the way displaying "Only Today" levels, now only show up within the current days price action.
リリースノート
Efficiency Update- Improved efficiency by reducing the number of plot lines required by adding "style=2" (Line with Breaks) to the plot options.
- Added fill colour for 2nd and 3rd Stddevs.
リリースノート
Minor update- Corrected no History flag "nohist" calculation, would misread the number of days of data left in the history.
オープンソーススクリプト
TradingViewの精神に則り、このスクリプトの作者はコードをオープンソースとして公開してくれました。トレーダーが内容を確認・検証できるようにという配慮です。作者に拍手を送りましょう!無料で利用できますが、コードの再公開はハウスルールに従う必要があります。
JustUncleL
免責事項
この情報および投稿は、TradingViewが提供または推奨する金融、投資、トレード、その他のアドバイスや推奨を意図するものではなく、それらを構成するものでもありません。詳細は利用規約をご覧ください。
オープンソーススクリプト
TradingViewの精神に則り、このスクリプトの作者はコードをオープンソースとして公開してくれました。トレーダーが内容を確認・検証できるようにという配慮です。作者に拍手を送りましょう!無料で利用できますが、コードの再公開はハウスルールに従う必要があります。
JustUncleL
免責事項
この情報および投稿は、TradingViewが提供または推奨する金融、投資、トレード、その他のアドバイスや推奨を意図するものではなく、それらを構成するものでもありません。詳細は利用規約をご覧ください。