OPEN-SOURCE SCRIPT
更新済 Momentum (80) + ATR (14)
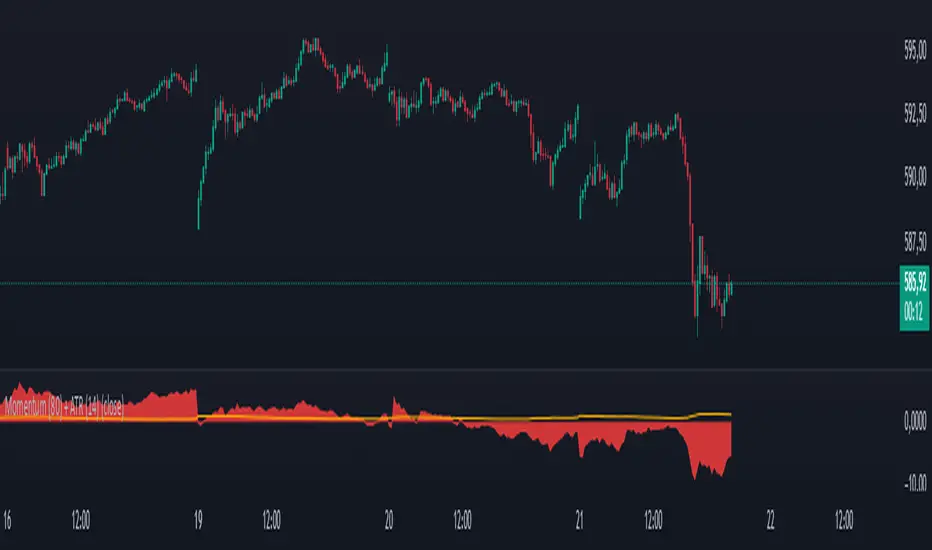
his indicator combines two essential technical analysis tools in a single panel for enhanced market insight:
🔹 Momentum (80 periods): Measures the difference between the current price and the price 80 bars ago. Displayed as a semi-transparent filled area, it helps to visually identify shifts in price momentum over a longer timeframe.
🔸 ATR (Average True Range, 14 periods): Shown as a fine orange line, the ATR represents average market volatility over 14 periods, highlighting phases of calm or increased price fluctuations.
By viewing both momentum and volatility simultaneously, traders can better assess trend strength and market conditions, improving decision-making across assets such as stocks, forex, and cryptocurrencies.
✅ Suitable for all asset types
✅ Complements other indicators like RSI, MACD, and Bollinger Bands
✅ Categorized under Momentum & Volatility indicators
リリースノート
📈 Momentum (80) + ATR (14) IndicatorThis custom indicator combines two essential technical tools—Momentum and Average True Range (ATR)—to help traders better interpret both market directional strength and volatility conditions in a single view.
🔹 Momentum (80)
The momentum component calculates the difference between the current closing price and the closing price 80 periods ago:
Momentum = Close - Close[80].
This long lookback period helps to smooth out noise and highlight sustained movements in price. The result is plotted as a filled area, visually emphasizing strong upward or downward momentum. It’s especially useful for identifying emerging trends or the weakening of existing ones.
🔹 ATR (14)
The Average True Range (ATR), using a standard 14-period setting, is plotted as a single line. It provides a real-time measure of market volatility by calculating the average range between high and low prices, adjusted for gaps.
A dynamic label shows the current ATR value on the latest bar, helping traders quickly assess whether volatility is increasing or contracting—key for position sizing and risk management.
オープンソーススクリプト
TradingViewの精神に則り、このスクリプトの作者はコードをオープンソースとして公開してくれました。トレーダーが内容を確認・検証できるようにという配慮です。作者に拍手を送りましょう!無料で利用できますが、コードの再公開はハウスルールに従う必要があります。
免責事項
この情報および投稿は、TradingViewが提供または推奨する金融、投資、トレード、その他のアドバイスや推奨を意図するものではなく、それらを構成するものでもありません。詳細は利用規約をご覧ください。
オープンソーススクリプト
TradingViewの精神に則り、このスクリプトの作者はコードをオープンソースとして公開してくれました。トレーダーが内容を確認・検証できるようにという配慮です。作者に拍手を送りましょう!無料で利用できますが、コードの再公開はハウスルールに従う必要があります。
免責事項
この情報および投稿は、TradingViewが提供または推奨する金融、投資、トレード、その他のアドバイスや推奨を意図するものではなく、それらを構成するものでもありません。詳細は利用規約をご覧ください。