OPEN-SOURCE SCRIPT
Positive Bars % Strategy
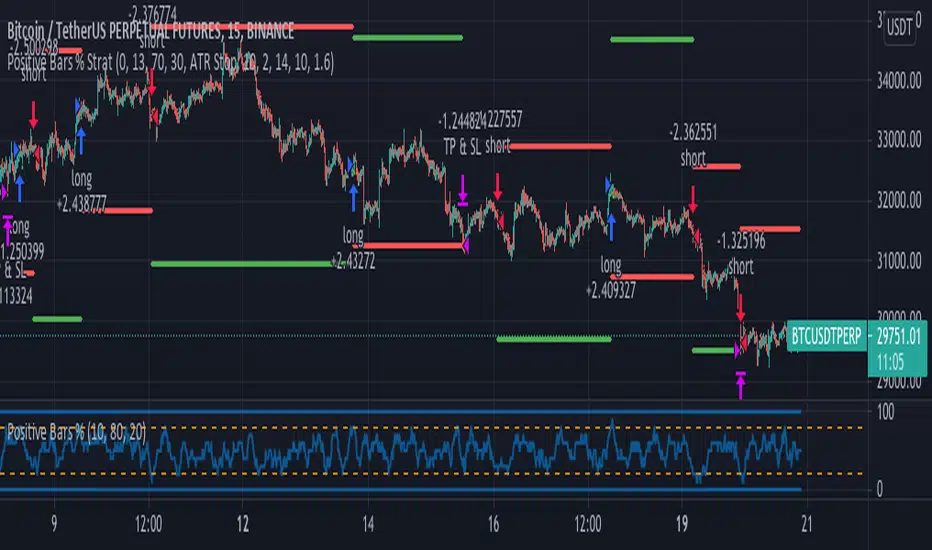
Based on the calculations by ZenAndTheArtOfTrading. I added stop loss, take profit and reverse code lines.
The Positive Bars % calculates the number of green (positive) bars, relative to a look back period, defined
by the user. If the percentage is low, it means that there was a bigger number of red candles in the
lookback period. The strategy goes long when the percentage is high and short when it's low.
This logic can be reversed with positive results on different time frames.
オープンソーススクリプト
TradingViewの精神に則り、このスクリプトの作者はコードをオープンソースとして公開してくれました。トレーダーが内容を確認・検証できるようにという配慮です。作者に拍手を送りましょう!無料で利用できますが、コードの再公開はハウスルールに従う必要があります。
免責事項
この情報および投稿は、TradingViewが提供または推奨する金融、投資、トレード、その他のアドバイスや推奨を意図するものではなく、それらを構成するものでもありません。詳細は利用規約をご覧ください。
オープンソーススクリプト
TradingViewの精神に則り、このスクリプトの作者はコードをオープンソースとして公開してくれました。トレーダーが内容を確認・検証できるようにという配慮です。作者に拍手を送りましょう!無料で利用できますが、コードの再公開はハウスルールに従う必要があります。
免責事項
この情報および投稿は、TradingViewが提供または推奨する金融、投資、トレード、その他のアドバイスや推奨を意図するものではなく、それらを構成するものでもありません。詳細は利用規約をご覧ください。