PROTECTED SOURCE SCRIPT
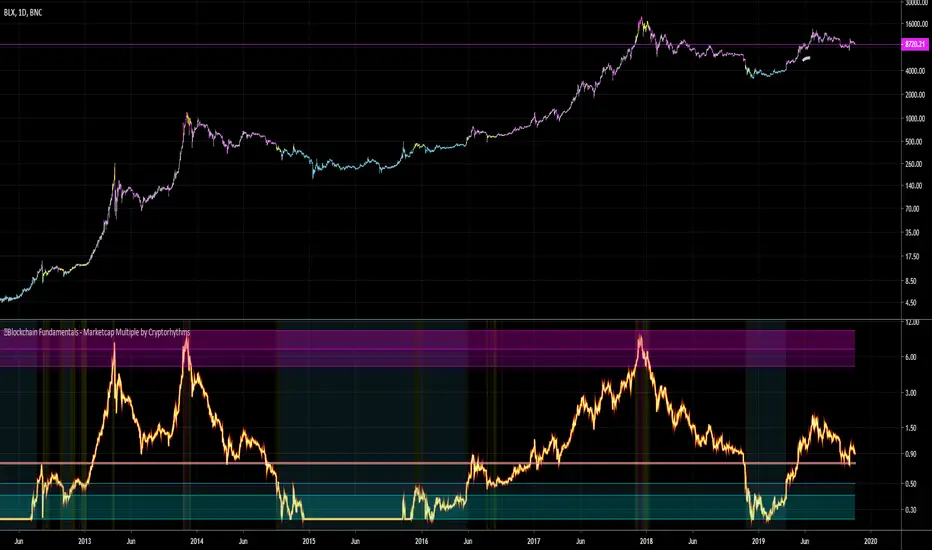
🔗Blockchain Fundamentals - Marketcap Multiple by Cryptorhythms
🔗Blockchain Fundamentals - Marketcap Multiple by Cryptorhythms
Intro
A brand new original indicator to judge long term bitcoin accumulation and distribution zones. Created by myself - theheirophant.
I love the way the indicator MVRV (market value to realized value) works, but there's no way to replicate it on tradingview as it uses outside data not available in the TV ecosystem. Then while looking at various marketcap alternatives, and idea was plain in front of my face!
Looking at marketcap + top cap + average cap creates a bounded area of price as seen here

Description
So I created an oscillator that shows marketcap's relation to top cap as the upper bound, and average cap as the lower bound. It then is rescaled from 0.25 to 10.
It should be viewed on a logrithmic scale and only works on the daily timeframe. You can enable/disable bar coloration and background highlighting from options.
It can be interpreted as times to accumulate and distribute on a long term basis. It would work well for trading spot markets.
The line at 0.75 acts as a sentiment indicator (above it is bullish, below it is bearish).
👍 Enjoying this indicator or find it useful? Please give me a like and follow (dont forget twitter also)! I post crypto analysis, price action strategies and free indicators regularly.
💬 Questions? Comments? Want to get access to an entire suite of proven trading indicators? Come visit us on telegram and chat. We make timely posts about the market, news, and strategy everyday. Our community isn't open only to subscribers - everyone is welcome to join. (check my sig)
Intro
A brand new original indicator to judge long term bitcoin accumulation and distribution zones. Created by myself - theheirophant.
I love the way the indicator MVRV (market value to realized value) works, but there's no way to replicate it on tradingview as it uses outside data not available in the TV ecosystem. Then while looking at various marketcap alternatives, and idea was plain in front of my face!
Looking at marketcap + top cap + average cap creates a bounded area of price as seen here
Description
So I created an oscillator that shows marketcap's relation to top cap as the upper bound, and average cap as the lower bound. It then is rescaled from 0.25 to 10.
It should be viewed on a logrithmic scale and only works on the daily timeframe. You can enable/disable bar coloration and background highlighting from options.
It can be interpreted as times to accumulate and distribute on a long term basis. It would work well for trading spot markets.
The line at 0.75 acts as a sentiment indicator (above it is bullish, below it is bearish).
👍 Enjoying this indicator or find it useful? Please give me a like and follow (dont forget twitter also)! I post crypto analysis, price action strategies and free indicators regularly.
💬 Questions? Comments? Want to get access to an entire suite of proven trading indicators? Come visit us on telegram and chat. We make timely posts about the market, news, and strategy everyday. Our community isn't open only to subscribers - everyone is welcome to join. (check my sig)
保護スクリプト
このスクリプトのソースコードは非公開で投稿されています。 ただし、制限なく自由に使用できます – 詳細はこちらでご確認ください。
Twitter - twitter.com/cryptorhythms
Cryptorhythms Group Chat - t.me/cryptorhythms
Cryptorhythms Group Chat - t.me/cryptorhythms
免責事項
この情報および投稿は、TradingViewが提供または推奨する金融、投資、トレード、その他のアドバイスや推奨を意図するものではなく、それらを構成するものでもありません。詳細は利用規約をご覧ください。