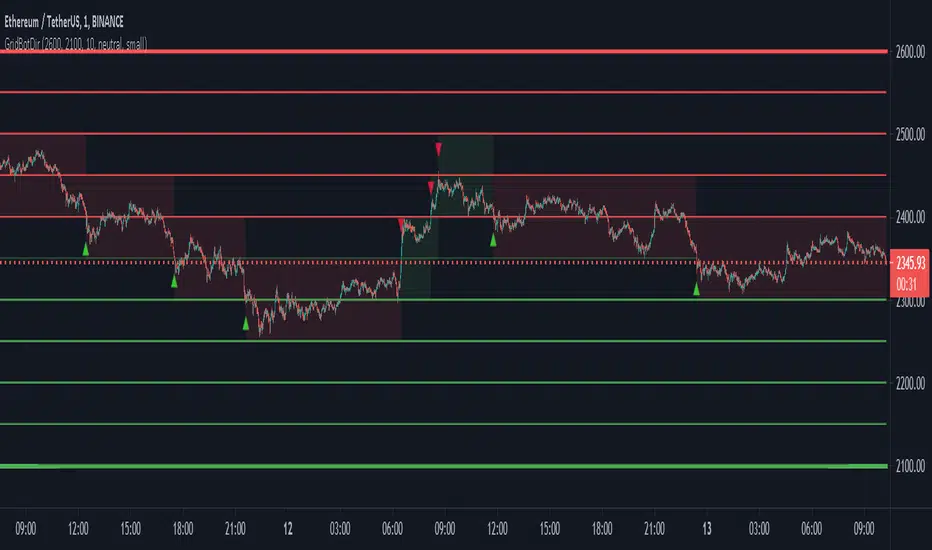
This script is a grid bot simulator for ranging/choppy markets. Prices are divided into grids, or trade zones, that will trigger signals each time a new zone is entered. During ranging markets, each transaction is followed by a “take profit.” As the market starts to trend, transactions are stacked (compare to DCA), until the market consolidates. No signals are triggered above the Upper Limit or Below the Lower Limit.
Settings overview:
Upper Limit/Lower Limit : Highest and Lowest values for entire grid.
Number of Grids: Number of trade zones.
Show Grids: Show or hide all gridlines.
Show Only Current Grids: Only display the grids just above and just below the current trade zone.
High/Low for signals: If enabled, signals are triggered as soon as the price touches the next zone. If disabled, signals are triggered after bar closes. Enable this for “Once Per Bar alerts. Disable for “Once Per Bar Close” alerts.

Highlight Trade Zones
The grid bot should work well during ranging/choppy markets. Each zone will have only one trade, and then will immediately take profit in the next zone.

Ranging/Choppy Market
However, trending markets can produce multiple signals in rapid succession:

Trending Market
If the gridlines are compressing the chart space, enable the “Show Only Current Grids” in settings.

Show Only Current Grids disabled

Show Only Current Grids enabled
When changing symbols, adjust the Upper and Lower Limits to accommodate the new symbol. Otherwise, the chart will look compressed.

XBTUSD chart with ETHUSDT settings
The bot is a proof-of-concept and is considered experimental. Possible future updates will include Fibonacci grids and “smart entry/exits,” depending on the current trend. Comments and suggestions are encouraged.
Settings overview:
Upper Limit/Lower Limit : Highest and Lowest values for entire grid.
Number of Grids: Number of trade zones.
Show Grids: Show or hide all gridlines.
Show Only Current Grids: Only display the grids just above and just below the current trade zone.
High/Low for signals: If enabled, signals are triggered as soon as the price touches the next zone. If disabled, signals are triggered after bar closes. Enable this for “Once Per Bar alerts. Disable for “Once Per Bar Close” alerts.
Highlight Trade Zones
The grid bot should work well during ranging/choppy markets. Each zone will have only one trade, and then will immediately take profit in the next zone.
Ranging/Choppy Market
However, trending markets can produce multiple signals in rapid succession:
Trending Market
If the gridlines are compressing the chart space, enable the “Show Only Current Grids” in settings.
Show Only Current Grids disabled
Show Only Current Grids enabled
When changing symbols, adjust the Upper and Lower Limits to accommodate the new symbol. Otherwise, the chart will look compressed.
XBTUSD chart with ETHUSDT settings
The bot is a proof-of-concept and is considered experimental. Possible future updates will include Fibonacci grids and “smart entry/exits,” depending on the current trend. Comments and suggestions are encouraged.
リリースノート
Adjusted signals to buy at LowerLimit and sell at UpperLimit if 'extremes' is enabled.リリースノート
- Added market direction filter. Bot will skip ever other signal against market direction (up or down).
- Added option for signal plot size.
リリースノート
Fixed Upper and Lower Limit lines not showingリリースノート
Fixed signal arrow sizesリリースノート
Fixed "Transp" deprecation warningリリースノート
New version available:https://www.tradingview.com/script/6k0tgcu9-Grid-Bot-Auto/
Grid Bot Auto
リリースノート
Update to Pinescript Version 5.New feature: Interactive upper/lower limit price selectors.
Use the price selectors to set the Upper and Lower Limits when adding the indicator to a new chart, or to interactively change the limits on a live chart.
To change Upper and Lower Limits on an active chart:
1. Click on the indicator to reveal the price selectors (tiny blue boxes)
2. Slide the boxes up or down to select the new price limits
When adding to a new chart, follow the prompts to set the “Upper Limit” price, then the “Lower Limit” price.
オープンソーススクリプト
TradingViewの精神に則り、このスクリプトの作者はコードをオープンソースとして公開してくれました。トレーダーが内容を確認・検証できるようにという配慮です。作者に拍手を送りましょう!無料で利用できますが、コードの再公開はハウスルールに従う必要があります。
USDT(ERC20):0x89c1ada92d53e88a06131a28693fd46101bdbecb
LTC:LWx9nAqbfZcWB5GBxUuBEpdBCFyVAmSFjm
ETH(ERC20):0x89c1ada92d53e88a06131a28693fd46101bdbecb
BTC:113pXq5Lxdp3UUgTpRng24sxX7YRE9dR61p
LTC:LWx9nAqbfZcWB5GBxUuBEpdBCFyVAmSFjm
ETH(ERC20):0x89c1ada92d53e88a06131a28693fd46101bdbecb
BTC:113pXq5Lxdp3UUgTpRng24sxX7YRE9dR61p
免責事項
この情報および投稿は、TradingViewが提供または推奨する金融、投資、トレード、その他のアドバイスや推奨を意図するものではなく、それらを構成するものでもありません。詳細は利用規約をご覧ください。
