OPEN-SOURCE SCRIPT
更新済 Advanced MA Difference (and more)

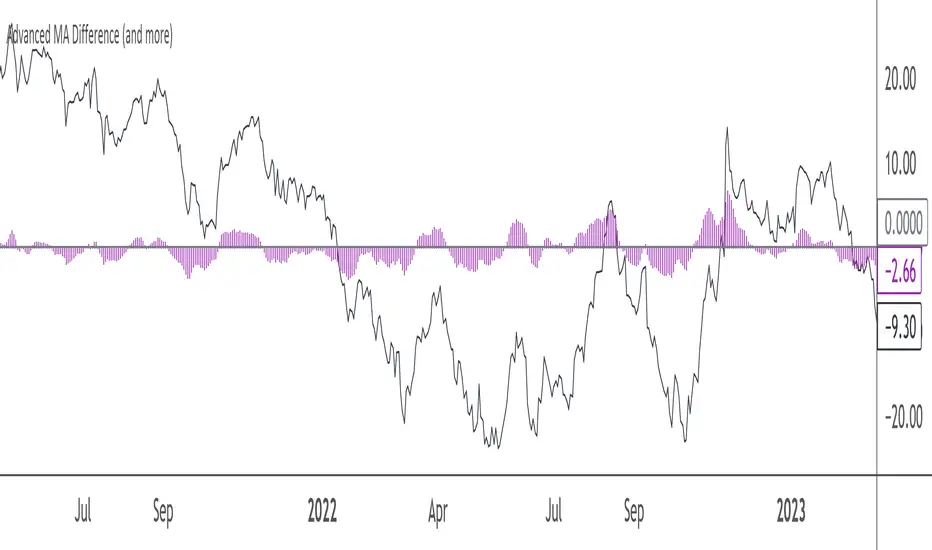
This Pine Script indicator calculates the difference between the price and a main moving average (SMA or EMA), allowing you to track deviations in either absolute or relative (percentage) terms. It offers several features to help visualize and smooth this difference:
- Main MA Difference: Shows the price deviation from the moving average, either as an absolute dollar amount or as a percentage.
- Fast and Slow Moving Averages: Optionally smooths the difference using fast and slow moving averages, giving insights into short-term and long-term trends in price deviations.
- Difference Between Fast and Slow MAs: Highlights the gap between these MAs, helping to identify momentum shifts.
- Customizable Visuals: Offers flexibility in displaying the difference and moving averages using lines or histograms, and includes a zero line for reference.
When to Use It:
- Use the absolute difference for tracking raw price deviations if you’re focused on concrete moves in the asset’s price.
- Use the relative difference for normalized, percentage-based deviations, especially useful when comparing different assets or time frames.
This indicator is suitable for traders looking to spot trends, price deviations, or momentum shifts relative to a moving average. Its flexibility makes it a good fit for both short-term and long-term analysis.
リリースノート
This updated Pine Script indicator calculates the difference between the price and a main moving average (SMA or EMA), with options to measure deviations in absolute or relative (percentage) terms. A key feature now allows users to choose between using closing prices or the "max interval distance" for the calculations:- Closing Price: Standard closing price for deviation calculations.
- Max Interval Distance: The highest or lowest point of the price range relative to the moving average, depending on whether the price closes above or below the MA.
Main Features:
- Difference from Main MA: Shows deviations as either an absolute value or percentage.
- Fast and Slow Moving Averages: These smooth the difference to highlight short-term and long-term trends.
- Difference Between Fast and Slow MAs: Identifies shifts in momentum by comparing the fast and slow MAs of the difference.
- Customizable Visuals: Displays lines or histograms, with a zero line for reference.
When to Use It:
- Use the closing price option for traditional price deviation tracking.
- Use the max interval distance to better capture extreme movements when the price crosses above or below the moving average.
This indicator is ideal for traders looking to monitor price deviations, track trend shifts, and detect momentum changes in relation to a moving average, with enhanced flexibility in how those deviations are calculated.
リリースノート
- Added the option to hide the calculated difference between price and the selected MA.オープンソーススクリプト
TradingViewの精神に則り、このスクリプトの作者はコードをオープンソースとして公開してくれました。トレーダーが内容を確認・検証できるようにという配慮です。作者に拍手を送りましょう!無料で利用できますが、コードの再公開はハウスルールに従う必要があります。
免責事項
この情報および投稿は、TradingViewが提供または推奨する金融、投資、トレード、その他のアドバイスや推奨を意図するものではなく、それらを構成するものでもありません。詳細は利用規約をご覧ください。
オープンソーススクリプト
TradingViewの精神に則り、このスクリプトの作者はコードをオープンソースとして公開してくれました。トレーダーが内容を確認・検証できるようにという配慮です。作者に拍手を送りましょう!無料で利用できますが、コードの再公開はハウスルールに従う必要があります。
免責事項
この情報および投稿は、TradingViewが提供または推奨する金融、投資、トレード、その他のアドバイスや推奨を意図するものではなく、それらを構成するものでもありません。詳細は利用規約をご覧ください。