OPEN-SOURCE SCRIPT
更新済 Reversal Indicator
█ OVERVIEW
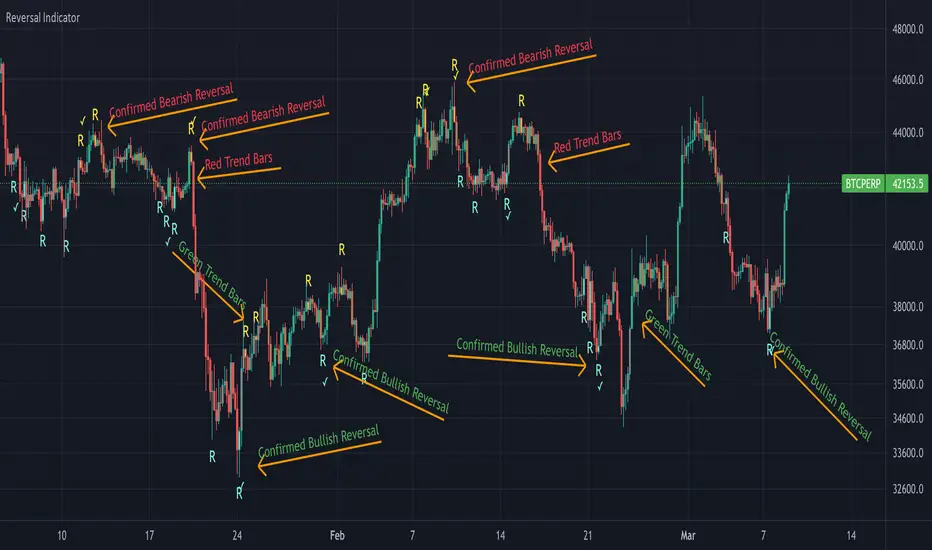
This indicator shows bullish and bearish reversal signal candles. It finds the candles with extreme volatility and marks the candles with high probability for a reversal of the trend.
█ CONCEPT
This indicator uses the Bollinger Bands to mark the candles with high selling/buying pressure. Bollinger Bands consist of three bands total: an upper band, middle band, and lower band. These separate bands are each used to highlight extreme prices in a specific security. The upper band is associated with overbought, whereas the lower band points to oversold, and the middle band acts as a moving average.
It is common after a lower band has been broken by heavy selling for the price of the asset to revert back above the point of the lower band and move closer to the middle band. The indicator marks this occurrence as a bullish reversal candle. Same applies vice versa. If the upper band is broken by heavy buying, it is natural for the price to revert back and move closer to the middle level. This indicator marks this as a bearish reversal candle.
█ HOW TO USE IT
Reversal Candles - Sky blue colored "R" indicates bullish reversal candle and yellow colored "R" indicates bearish reversal candle.
Checkmarks - Checkmarks provide a confirmation that the reversal has already begun with the candle next to the signal candle. Always wait for confirmation before considering it as a reversal of the trend.
RSI confluence - Enabling this check box in settings will show the reversal signal only when the RSI is overbought/oversold
█ LIMITATION
As like in any indicator, this indicator needs to be used with the assistance of other indicators to make conceptual and strategic trading decisions.
リリースノート
█ AlertsThe new version will allow you to setup alerts for reversal signal. Alerts can be set for likely bullish/bearish reversal candles or confirmed bullish/bearish candles.
If you need help in setting up alerts, refer this TradingView documentation.
tradingview.com/support/solutions/43000595315-how-to-set-up-alerts/
█ Trend Bars
The new version will paint the candles with green/red bars based on the current trend. Trend bars will keep you from getting shaken out by staying course of only the macro trend. You can disable the trend bar in the settings if you don't want.
リリースノート
This version allows you to add alerts for any kind of reversal (Bull/Bear - Reversal/Confirmed reversal)オープンソーススクリプト
In true TradingView spirit, the creator of this script has made it open-source, so that traders can review and verify its functionality. Kudos to the author! While you can use it for free, remember that republishing the code is subject to our House Rules.
免責事項
この情報および投稿は、TradingViewが提供または推奨する金融、投資、トレード、その他のアドバイスや推奨を意図するものではなく、それらを構成するものでもありません。詳細は利用規約をご覧ください。
オープンソーススクリプト
In true TradingView spirit, the creator of this script has made it open-source, so that traders can review and verify its functionality. Kudos to the author! While you can use it for free, remember that republishing the code is subject to our House Rules.
免責事項
この情報および投稿は、TradingViewが提供または推奨する金融、投資、トレード、その他のアドバイスや推奨を意図するものではなく、それらを構成するものでもありません。詳細は利用規約をご覧ください。