OPEN-SOURCE SCRIPT
更新済 Show Daily Candles on Intraday Chart
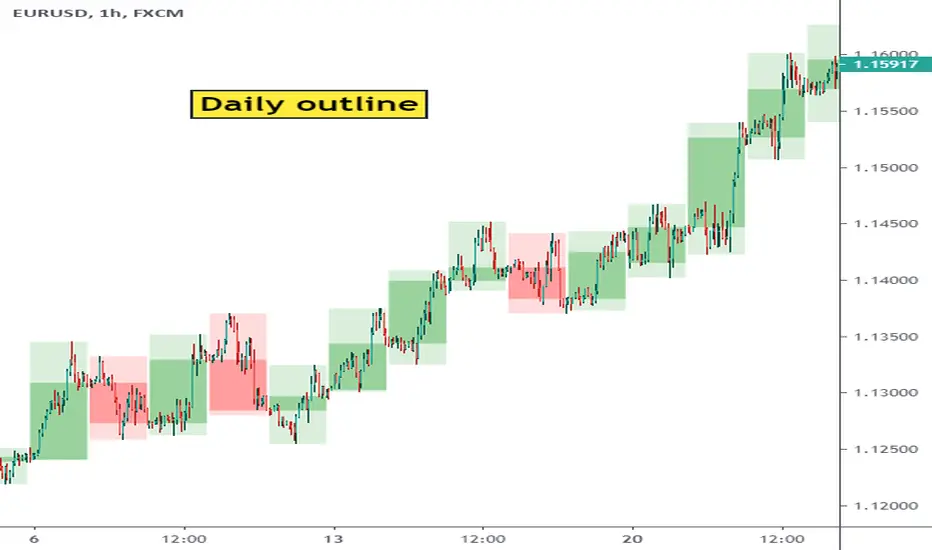
This script shows daily candle outlines on intraday periods. You can use this to simultaneously see what is happening on 'the bigger picture' without changing timeframe.
To address Tradingview moderation comments - this script only shows the outlines of completed days. So the most recent candle outline the indicator will show is yesterday.
I've not used the indicator in live trading yet so I don't know whether its going to be of useful to me yet but it was easy to code so I thought I'd give it a go. (Perhaps it will useful to people on the free tradingview subscription who have limited multi-chart options)
リリースノート
Does not function properly below 10 min periods so i deactivated it if you're on that timeframe. Pinescript does not seem to be able to look back more than 1000 bars so the script can not find where the day starts on the low timeframes...
リリースノート
other update had wrong image...リリースノート
You can now show Weekly and Monthly candles. Use the indicator options tabオープンソーススクリプト
TradingViewの精神に則り、このスクリプトの作者はコードをオープンソースとして公開してくれました。トレーダーが内容を確認・検証できるようにという配慮です。作者に拍手を送りましょう!無料で利用できますが、コードの再公開はハウスルールに従う必要があります。
免責事項
この情報および投稿は、TradingViewが提供または推奨する金融、投資、トレード、その他のアドバイスや推奨を意図するものではなく、それらを構成するものでもありません。詳細は利用規約をご覧ください。
オープンソーススクリプト
TradingViewの精神に則り、このスクリプトの作者はコードをオープンソースとして公開してくれました。トレーダーが内容を確認・検証できるようにという配慮です。作者に拍手を送りましょう!無料で利用できますが、コードの再公開はハウスルールに従う必要があります。
免責事項
この情報および投稿は、TradingViewが提供または推奨する金融、投資、トレード、その他のアドバイスや推奨を意図するものではなく、それらを構成するものでもありません。詳細は利用規約をご覧ください。