PROTECTED SOURCE SCRIPT
RSI -> PROFABIGHI_CAPITAL
🌟 Overview
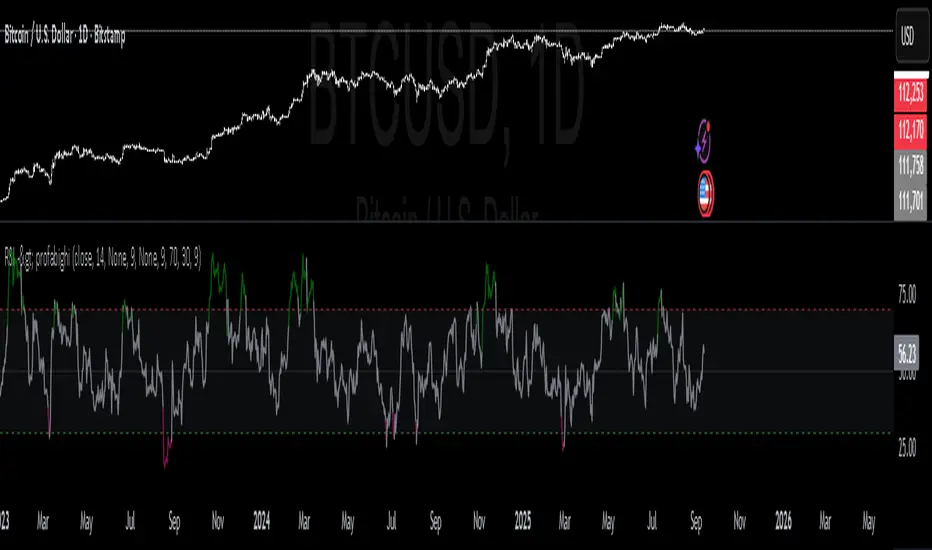
This RSI → PROFABIGHI_CAPITAL implements an advanced Relative Strength Index with sophisticated dual-layer smoothing capabilities and enhanced visualization for superior momentum analysis and overbought/oversold identification.
It provides Multi-method smoothing system supporting nine different moving average types for RSI refinement, Dual-smoothing architecture enabling comparison between two independently configured smoothed RSI lines, VIDYA volatility-adaptive smoothing for dynamic market condition responsiveness, and Enhanced visual framework with color-coded signals and customizable extreme level zones for comprehensive momentum oscillator analysis.
🔧 Advanced RSI Configuration Framework
- Professional RSI implementation with customizable price source selection and adjustable calculation periods for different market sensitivities
- RSI Source Selection enabling close, high, low, or other price inputs for flexible momentum calculation adaptation
- RSI Length Configuration providing adjustable calculation periods balancing responsiveness versus smoothness for different trading styles
- Extreme Level Management offering configurable overbought and oversold thresholds for personalized signal generation
- VIDYA Volatility Integration using Variable Index Dynamic Average with configurable volatility lookback for adaptive smoothing
- Precision Controls supporting price formatting and decimal precision for accurate momentum measurement display
📊 Multi-Method Smoothing Engine
- Nine Smoothing Options supporting SMA, EMA, WMA, HMA, RMA, LSMA, DEMA, TEMA, and VIDYA methods for comprehensive RSI refinement
- First Layer Smoothing providing primary RSI smoothing with configurable method selection and period adjustment for noise reduction
- Second Layer Smoothing enabling additional smoothing layer with independent method and period configuration for enhanced signal clarity
- Advanced Moving Averages implementing DEMA and TEMA calculations for reduced lag and improved responsiveness
- Hull Moving Average Integration offering HMA smoothing for optimal balance between smoothness and responsiveness
- Linear Regression Smoothing providing LSMA option for trend-following RSI interpretation with mathematical precision
- VIDYA Implementation using volatility-adjusted smoothing that adapts to market conditions automatically
🔄 Dual-Smoothing Comparison System
- Independent Smoothing Layers allowing separate configuration of two different smoothing methods and periods for RSI comparison
- Comparison Mode Activation enabling dual-line display with crossover analysis for enhanced signal generation
- Color-Coded Relationship using green coloring when first smoothed RSI is below second smoothed RSI and red when above
- Crossover Signal Generation providing visual cues for momentum shifts through smoothed RSI line intersections
- Flexible Configuration supporting any combination of smoothing methods for customized momentum analysis
- Signal Validation Framework using dual-smoothing agreement for higher-confidence momentum signals
📈 VIDYA Volatility-Adaptive Implementation
- Volatility Measurement System calculating standard deviation of RSI values over configurable lookback periods for market condition assessment
- Adaptive Smoothing Factor automatically adjusting smoothing intensity based on current market volatility levels
- Alpha Coefficient Calculation using mathematical formulation for optimal smoothing factor determination
- K-Factor Integration implementing volatility ratio for dynamic smoothing adjustment with boundary constraints
- Mathematical Precision ensuring proper VIDYA calculation through error handling and edge case management
- Market Condition Responsiveness providing more smoothing during calm markets and less during volatile periods
🎨 Enhanced Visual Framework
- Dynamic Color Coding System using dark green for extreme overbought conditions, dark red for extreme oversold conditions, and gray for neutral zones
- Dual-Line Visualization displaying primary smoothed RSI with prominent line width and secondary smoothed RSI with thinner reference line
- Comparison Mode Coloring implementing synchronized green/red coloring for both lines based on their relative positions
- Background Raw RSI Display showing unsmoothed RSI as subtle background reference when smoothing is applied
- Extreme Zone Highlighting filling area between overbought and oversold levels with subtle background color for clear zone identification
- Reference Line Framework displaying horizontal lines for extreme high, extreme low, and middle levels with customizable transparency
⚙️ Advanced Signal Generation Logic
- Single-Line Mode Signals generating color-coded momentum signals based on smoothed RSI crossing extreme overbought and oversold thresholds
- Comparison Mode Signals creating crossover-based signals when first smoothed RSI crosses above or below second smoothed RSI
- Extreme Level Detection identifying when smoothed RSI enters overbought territory above extreme high threshold or oversold territory below extreme low threshold
- Momentum Shift Recognition highlighting transitions between bullish and bearish momentum states through color changes
- Signal Persistence Tracking maintaining color states until opposing conditions develop for clear trend identification
- Neutral Zone Management displaying gray coloring when RSI remains between extreme thresholds indicating consolidation periods
🔍 Mathematical Implementation Framework
- RSI Calculation Accuracy using Pine Script's built-in RSI function for precise momentum oscillator computation
- DEMA Mathematical Formula implementing double exponential moving average calculation with proper lag reduction methodology
- TEMA Advanced Calculation using triple exponential moving average formulation for enhanced smoothing with minimal lag
- Null Value Protection ensuring continuous calculation through proper handling of undefined values and edge cases
- Smoothing Fallback Logic providing raw RSI values when smoothing calculations encounter mathematical issues
- Precision Maintenance preserving calculation accuracy across different smoothing methods and market conditions
📊 Professional Display Features
- Configurable Extreme Levels supporting custom overbought and oversold threshold settings for different market environments
- Middle Reference Line displaying 50-level dotted line for momentum direction and strength assessment
- Transparency Controls using appropriate transparency levels for background elements and reference lines
- Line Weight Hierarchy implementing visual hierarchy through different line weights for primary and secondary elements
- Zone Fill Visualization providing subtle background fill between extreme levels for immediate zone identification
- Raw RSI Background Reference showing original unsmoothed RSI when smoothing is applied for comparison purposes
⚡ Performance Optimization Features
- Conditional Plotting displaying elements only when relevant smoothing options are enabled for chart performance
- Efficient Calculation Methods using optimized mathematical formulations for real-time smoothing computation
- Memory Management implementing efficient variable usage and calculation sequences for minimal resource consumption
- Real-Time Updates providing immediate smoothed RSI values and color changes with each new price bar
- Error Prevention Framework incorporating validation and fallback mechanisms for reliable indicator operation
- Timeframe Compatibility supporting multiple timeframe analysis with proper gap handling and data continuity
✅ Key Takeaways
- Advanced RSI implementation with sophisticated dual-layer smoothing using nine different moving average methods for enhanced momentum analysis
- VIDYA volatility-adaptive smoothing providing automatic market condition responsiveness for optimal signal quality in different environments
- Dual-smoothing comparison system enabling crossover analysis between two independently configured smoothed RSI lines for enhanced signal generation
- Professional visualization framework with dynamic color coding, extreme zone highlighting, and configurable reference levels for immediate analysis
- Mathematical precision implementation using proper DEMA, TEMA, and VIDYA calculations with comprehensive error handling and edge case management
- Flexible configuration options supporting different trading styles and market conditions through customizable smoothing methods and extreme level thresholds
- Performance-optimized design with conditional plotting and efficient calculations for real-time momentum analysis without chart performance impact
保護スクリプト
このスクリプトのソースコードは非公開で投稿されています。 しかし、無料かつ制限なしでご利用いただけます ― 詳細についてはこちらをご覧ください。
免責事項
これらの情報および投稿は、TradingViewが提供または保証する金融、投資、取引、またはその他の種類のアドバイスや推奨を意図したものではなく、またそのようなものでもありません。詳しくは利用規約をご覧ください。
保護スクリプト
このスクリプトのソースコードは非公開で投稿されています。 しかし、無料かつ制限なしでご利用いただけます ― 詳細についてはこちらをご覧ください。
免責事項
これらの情報および投稿は、TradingViewが提供または保証する金融、投資、取引、またはその他の種類のアドバイスや推奨を意図したものではなく、またそのようなものでもありません。詳しくは利用規約をご覧ください。