OPEN-SOURCE SCRIPT
CME FX Futures Correlation Matrix
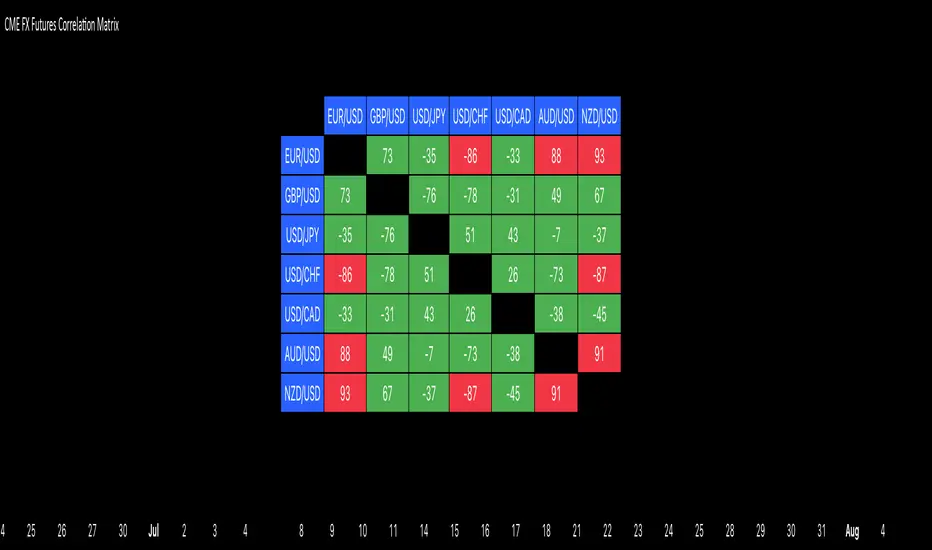
This indicator calculates the correlation between major CME FX futures and displays it in a visual table. It shows how closely pairs like EUR/USD, GBP/USD, USD/JPY, USD/CHF, USD/CAD, AUD/USD, and NZD/USD move together or in opposite directions.
The indicator inherits the timeframe of the chart it’s applied to.
Color coding:
How to launch it
The indicator inherits the timeframe of the chart it’s applied to.
Color coding:
- Red: strong correlation (absolute value > 80%), both positive and negative
- Green: moderate/low correlation
How to launch it
- Apply the indicator to a CME chart (e.g., EUR/USD futures).
- Set Numbers of Bars Back to the desired lookback period (default 100).
- The table appears in the center of the chart, showing correlation percentages between all major FX futures.
オープンソーススクリプト
TradingViewの精神に則り、このスクリプトの作者はコードをオープンソースとして公開してくれました。トレーダーが内容を確認・検証できるようにという配慮です。作者に拍手を送りましょう!無料で利用できますが、コードの再公開はハウスルールに従う必要があります。
免責事項
この情報および投稿は、TradingViewが提供または推奨する金融、投資、トレード、その他のアドバイスや推奨を意図するものではなく、それらを構成するものでもありません。詳細は利用規約をご覧ください。
オープンソーススクリプト
TradingViewの精神に則り、このスクリプトの作者はコードをオープンソースとして公開してくれました。トレーダーが内容を確認・検証できるようにという配慮です。作者に拍手を送りましょう!無料で利用できますが、コードの再公開はハウスルールに従う必要があります。
免責事項
この情報および投稿は、TradingViewが提供または推奨する金融、投資、トレード、その他のアドバイスや推奨を意図するものではなく、それらを構成するものでもありません。詳細は利用規約をご覧ください。