OPEN-SOURCE SCRIPT
Elder Force Index Oscillator @shrilss
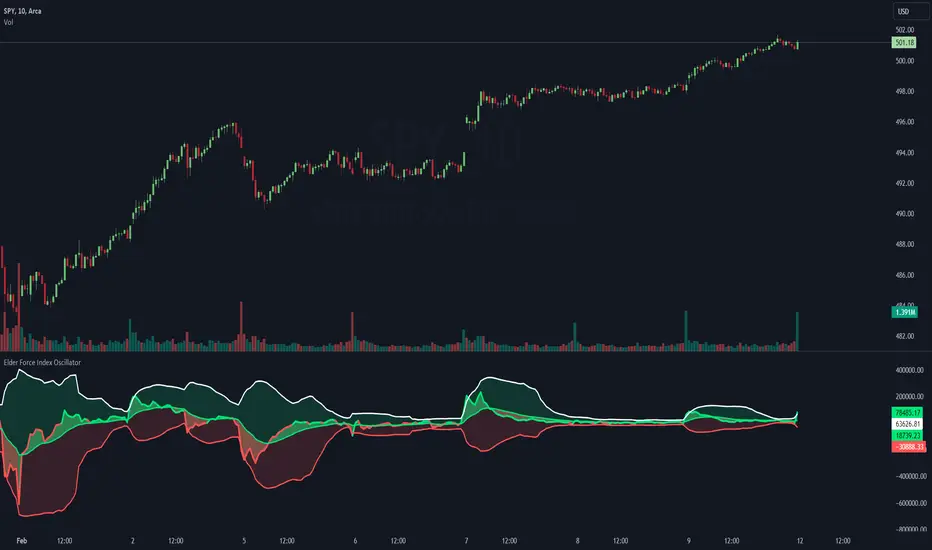
The "Elder Force Index Oscillator" is a comprehensive tool designed to assess the strength and direction of trends in the market. This indicator combines volume and price movement to provide traders with valuable insights into market dynamics.
Key Features:
- Volume Weighted: The oscillator considers both price changes and volume, emphasizing the significance of volume in confirming price movements.
- Trend Identification: Utilizing exponential moving averages (EMAs) and Bollinger Bands (BB), the indicator identifies potential trend reversals and continuations.
- Trend Strength Highlighting: With customizable options, the script highlights areas of strong and weak trend initiation, aiding traders in making informed decisions.
How It Works:
- Elder Force Index (EFI): The EFI is calculated as the EMA of price changes multiplied by volume. A positive value suggests buying pressure, while a negative value indicates selling pressure.
- EFI Moving Average (EFI MA): This smooths out the EFI, providing a clearer indication of trend direction.
- Bollinger Bands (BB): The upper and lower bands are calculated based on a specified number of standard deviations from the EFI's moving average, offering insights into potential overbought or oversold conditions.
オープンソーススクリプト
TradingViewの精神に則り、このスクリプトの作者はコードをオープンソースとして公開してくれました。トレーダーが内容を確認・検証できるようにという配慮です。作者に拍手を送りましょう!無料で利用できますが、コードの再公開はハウスルールに従う必要があります。
免責事項
この情報および投稿は、TradingViewが提供または推奨する金融、投資、トレード、その他のアドバイスや推奨を意図するものではなく、それらを構成するものでもありません。詳細は利用規約をご覧ください。
オープンソーススクリプト
TradingViewの精神に則り、このスクリプトの作者はコードをオープンソースとして公開してくれました。トレーダーが内容を確認・検証できるようにという配慮です。作者に拍手を送りましょう!無料で利用できますが、コードの再公開はハウスルールに従う必要があります。
免責事項
この情報および投稿は、TradingViewが提供または推奨する金融、投資、トレード、その他のアドバイスや推奨を意図するものではなく、それらを構成するものでもありません。詳細は利用規約をご覧ください。