OPEN-SOURCE SCRIPT
Multi-Timeframe Support & Resistance
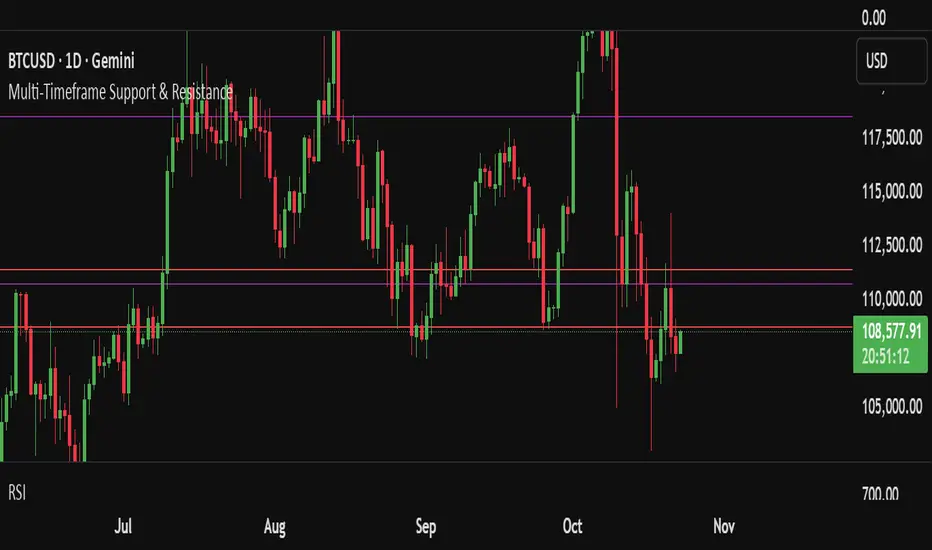
This indicator automatically plots dynamic support and resistance levels across multiple timeframes — including 1H, 4H, 1D, 1W, 1M, and the current chart timeframe. Each level is color-coded for clarity and extends across the chart to highlight key price zones.
**Key Features:**
- ⏱ Multi-timeframe analysis: 6 configurable timeframes
- 🎨 Custom color and style settings for each timeframe
- 📏 Adjustable number of levels per timeframe
- 🧼 Clean chart layout with no duplicate lines
- 🔄 Auto-refresh every 10 bars for up-to-date levels
Support and resistance levels are calculated using historical high/low ranges and evenly distributed across the selected lookback period. This helps traders identify confluence zones, breakout targets, and reversal areas with precision.
オープンソーススクリプト
TradingViewの精神に則り、このスクリプトの作者はコードをオープンソースとして公開してくれました。トレーダーが内容を確認・検証できるようにという配慮です。作者に拍手を送りましょう!無料で利用できますが、コードの再公開はハウスルールに従う必要があります。
免責事項
この情報および投稿は、TradingViewが提供または推奨する金融、投資、トレード、その他のアドバイスや推奨を意図するものではなく、それらを構成するものでもありません。詳細は利用規約をご覧ください。
オープンソーススクリプト
TradingViewの精神に則り、このスクリプトの作者はコードをオープンソースとして公開してくれました。トレーダーが内容を確認・検証できるようにという配慮です。作者に拍手を送りましょう!無料で利用できますが、コードの再公開はハウスルールに従う必要があります。
免責事項
この情報および投稿は、TradingViewが提供または推奨する金融、投資、トレード、その他のアドバイスや推奨を意図するものではなく、それらを構成するものでもありません。詳細は利用規約をご覧ください。