OPEN-SOURCE SCRIPT
更新済 Cheat Code
Why Monday & Friday
Monday evening (NY): frequently seeds the weekly expansion. Its DR/IDR often acts as a weekly “starter envelope,” useful for breakout continuation or fade back into the box plays as liquidity builds.
Friday evening (NY): often exposes end-of-week traps (run on stops into the close) and sets expectation boundaries into the following week. Carry these levels forward to catch Monday’s reaction to Friday’s closing structure.
Typical use-cases
Breakout & retest:
Price closes outside the Monday DR/IDR → look for retests of the band edge for continuation.
Liquidity sweep (“trap”) recognition:
Friday session wicks briefly beyond Friday DR/IDR then closes back inside → watch for mean reversion early next week.
Bias filter:
Above both Monday DR midline and Friday DR midline → bias long until proven otherwise; the inverse for shorts.
Session open confluence:
Reactions at the open line frequently mark decision points for momentum vs. fade setups.
(This is a levels framework, not a signals engine. Combine with your execution model: orderflow, S/R, session timing, or higher-TF bias.)
Inputs & styling (quick reference)
Display toggles (per day):
Show DR / IDR / Middle DR / Middle IDR
Show Opening Line
Show DR/IDR Box (choose DR or IDR as box source)
Show Price Labels
Style controls (per day):
Line width (1–4), style (Solid/Dashed/Dotted)
Independent colors for DR, IDR, midlines, open line
Box background opacity
Timezone:
Default America/New_York (changeable).
Optional on-chart warning if your chart TZ differs.
Practical notes
Works on intraday charts; levels are anchored using weekly timestamps for accuracy on any symbol.
Live updating: During the Mon/Fri calc windows, DR/IDR highs/lows and midlines keep updating until the session ends.
Clean drawings: Lines, box, and labels are created once per session and then extended/updated—efficient on resources even with long display windows.
Max elements: Script reserves ample line/box/label capacity for stability across weeks.
リリースノート
1. Sessions it tracksThis script is only about Monday evening and Friday evening trading sessions in America/New_York time:
Monday session: from 19:30 → 23:00 (NY time)
Friday session: from 19:30 → 23:00 (NY time)
It does not track the rest of the week.
2. What it measures inside each session
For each session, it calculates two ranges:
DR (Daily Range):
The session’s highest high and lowest low between 19:30–23:00.
IDR (Initial / Inside Range):
The range between the max(open, close) and min(open, close) of all the candles inside that session (basically the body extremes, ignoring wicks).
It also records:
The middle of the DR (avg(high, low)).
The middle of the IDR (avg(max(open,close), min(open,close))).
The opening price of the session (first bar at 19:30).
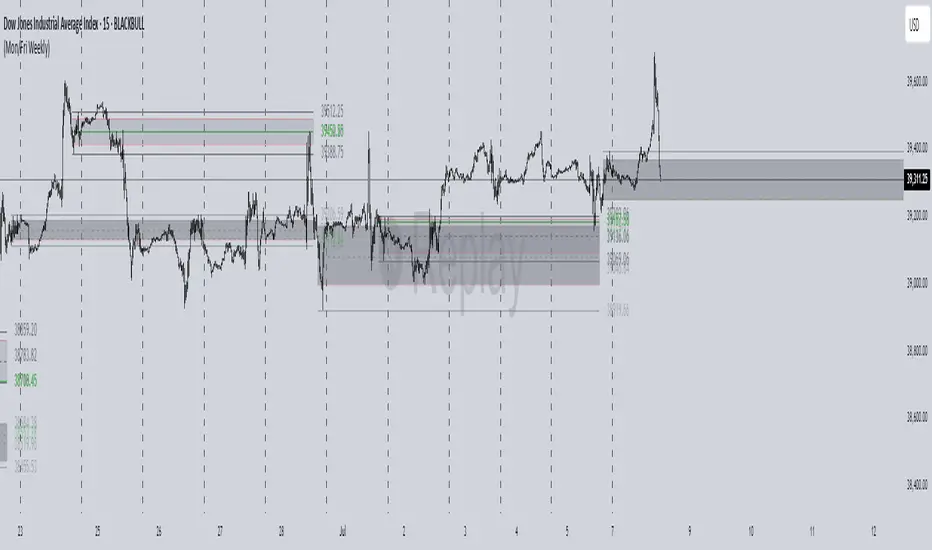
3. Drawing logic
It plots these ranges on your chart:
Box:
Draws a shaded box covering either the DR or IDR (your choice), extending beyond the session:
Monday’s box extends until Friday 18:00 of the same week.
Friday’s box extends until next Friday 18:00.
Lines:
Horizontal lines at:
DR high & low (and optional middle).
IDR high & low (and optional middle).
Session open price.
All lines extend until the end of the extension window.
Labels:
Price labels at the right edge of each line, if enabled.
Styles:
You can toggle each feature on/off (box, DR lines, IDR lines, midlines, open line, labels).
You can also choose colors, line styles (solid/dashed/dotted), and widths separately for Monday and Friday.
オープンソーススクリプト
TradingViewの精神に則り、このスクリプトの作者はコードをオープンソースとして公開してくれました。トレーダーが内容を確認・検証できるようにという配慮です。作者に拍手を送りましょう!無料で利用できますが、コードの再公開はハウスルールに従う必要があります。
免責事項
この情報および投稿は、TradingViewが提供または推奨する金融、投資、トレード、その他のアドバイスや推奨を意図するものではなく、それらを構成するものでもありません。詳細は利用規約をご覧ください。
オープンソーススクリプト
TradingViewの精神に則り、このスクリプトの作者はコードをオープンソースとして公開してくれました。トレーダーが内容を確認・検証できるようにという配慮です。作者に拍手を送りましょう!無料で利用できますが、コードの再公開はハウスルールに従う必要があります。
免責事項
この情報および投稿は、TradingViewが提供または推奨する金融、投資、トレード、その他のアドバイスや推奨を意図するものではなく、それらを構成するものでもありません。詳細は利用規約をご覧ください。