OPEN-SOURCE SCRIPT
Slope
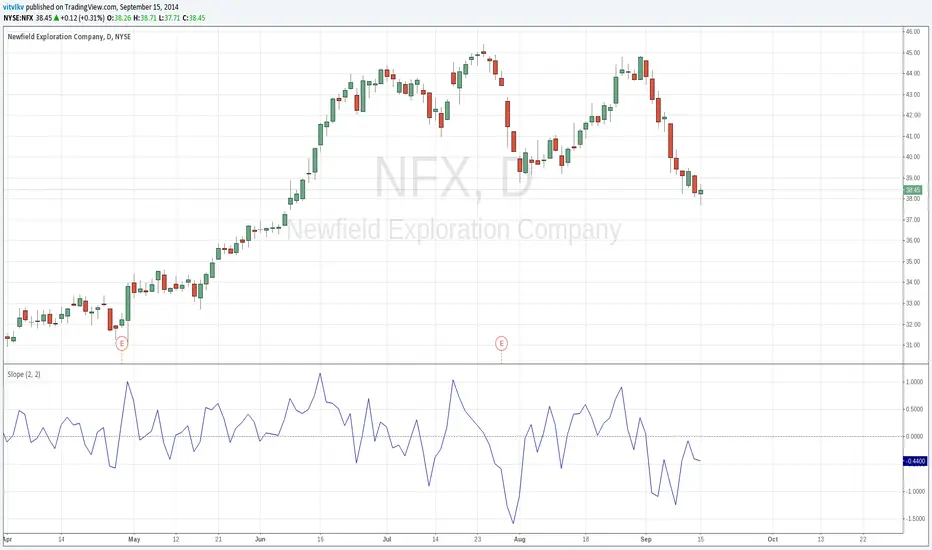
The slope indicator measures the rise-over-run of a linear regression, which is the line of best fit for a price series. Fluctuating above and below zero, the Slope indicator best resembles a momentum oscillator without boundaries. It is not well suited for overbought/oversold levels, but can measure the direction and strength of a trend. It can also be used with other indicators do identify potential entry points within an ongoing trend. (stockcharts.com/school/doku.php?id=chart_school:technical_indicators:slope)
オープンソーススクリプト
TradingViewの精神に則り、このスクリプトの作者はコードをオープンソースとして公開してくれました。トレーダーが内容を確認・検証できるようにという配慮です。作者に拍手を送りましょう!無料で利用できますが、コードの再公開はハウスルールに従う必要があります。
免責事項
この情報および投稿は、TradingViewが提供または推奨する金融、投資、トレード、その他のアドバイスや推奨を意図するものではなく、それらを構成するものでもありません。詳細は利用規約をご覧ください。
オープンソーススクリプト
TradingViewの精神に則り、このスクリプトの作者はコードをオープンソースとして公開してくれました。トレーダーが内容を確認・検証できるようにという配慮です。作者に拍手を送りましょう!無料で利用できますが、コードの再公開はハウスルールに従う必要があります。
免責事項
この情報および投稿は、TradingViewが提供または推奨する金融、投資、トレード、その他のアドバイスや推奨を意図するものではなく、それらを構成するものでもありません。詳細は利用規約をご覧ください。